Composition and Comprehensive Evaluation of Free Amino Acids in Different Brassica campestris Cultivars
-
摘要: 为系统评估不同品种菜薹游离氨基酸(free amino acids,FAA)总体品质的差异性,以16个不同菜薹品种为研究对象,通过高效液相色谱法检测其FAA种类和含量,运用味道强度值(taste activity value,TAV)、相关性分析法(correlation analysis,CA)、主成分分析法(principal component analysis,PCA)、聚类分析法(hierarchical cluster analysis,HCA)对菜薹FAA进行综合评价。结果表明:16种菜薹中共含有22~23种FAA,其中瓜氨酸(Cit)在部分品种菜薹未检出;各菜薹总氨基酸含量(total free amino acid,TFAA)范围为1.30~6.77 mg/g,油菜薹XT-3的TFAA含量最高,白菜薹CT-4浓度最低。TAV结果表明鲜味氨基酸是主要呈味氨基酸,以谷氨酰胺(Gln)和谷氨酸(Glu)为主要贡献氨基酸;药用氨基酸成分偏高,含量范围在0.34~1.95 mg/g。不同种质菜薹FAA间相关性较好,甘氨酸(Gly)仅与半胱氨酸(Cys)呈极显著正相关(P<0.01)。运用PCA共提取4个主成分,累计方差贡献率为87.022%,能有效解析所有FAA信息特征。HCA结果与PCA结果一致,16个菜薹品种被划分成3大类;通过综合评估得出排名前3的品种分别为油菜薹XT-3、XT-4和紫红菜薹ZM-2。以上结果能有效体现出不同种质菜薹FAA间的差异性,为菜薹种质选育、产品研发提供一定的理论依据。Abstract: This study aimed to evaluate the differences in the overall quality of free amino acid (FAA) in different varieties of Brassica campestris. The types and contents of FAA were detected by high performance liquid chromatography (HPLC), and the FAA compositions of the 16 Brassica campestris cultivars were evaluated by taste activity value (TAV), correlation analysis (CA), principal component analysis (PCA) and hierarchical cluster analysis (HCA). Results showed that there were 22~23 FAA in 16 kinds of Brassica campestris, among which citrulline (Cit) was not detected in some varieties. The total free amino acid (TFAA) content of Brassica campestris was in the range of 1.30~6.77 mg/g, with the highest TFAA content in XT-3 and the lowest in CT-4. The TAV results showed that umami amino acids were the main flavor amino acids, and glutamine (Gln) and glutamic acid (Glu) were the main contributing amino acids. The medicinal amino acids were abundant, with the contents range of 0.34~1.95 mg/g. The correlation between the FAA of different Brassica campestris varieties was excellent, while the correlation between the FAA of glycine (Gly) and cysteine (Cys) was only positively significant (P<0.01). Four principal components were extracted using PCA, with a cumulative variance contribution rate of 87.022%, which could effectively analyze all the FAA information characteristics. The HCA results were consistent with the PCA, and the 16 Brassica campestris cultivars were categorized into 3 major groups. The top 3 varieties ranked by the comprehensive evaluation were XT-3, XT-4 and ZM-2, respectively. These results could effectively reflect the differences between the FAA of different germplasm of Brassica campestris, and provide some theoretical basis for idioplasmic selection and product development of Brassica campestris.
-
菜薹(Brassica campestris L. ssp. chinensis var. perperea Hort.)别名菜心,属十字花科芸薹属白菜亚种的变种,由薹茎和花叶组成。菜薹常用于烹炒或煲汤,鲜甜香醇,脆爽可口,以“蔬菜之冠”而闻名[1]。此外,菜薹中还富含蛋白质、维生素C、膳食纤维等多种功能成分,对人体有清热解毒、活血化瘀等功效[2]。菜薹在国内外均有选育培植,在我国主要分布在南方地区(湖南、广东、广西等),其中湖南年栽培面积约5.34万hm2[3]。经过专家长期创新培育,菜薹已产生了不同的类别和种质。由于目前市面上的菜薹主要分为白菜薹、红菜薹、油菜薹等,不同品种间品质特征差异较为显著。因此对不同品种菜薹理化指标进行科学分析,有利于菜薹资源的综合利用及产品研发。
游离氨基酸(free amino acid,FAA)是一种未与蛋白质结合的单个氨基酸,可根据其种类及含量评估所含食品的营养和功能价值[4−5]。另外,FAA是挥发性风味物质的前提物质,参与风味的形成和变化。如美拉德反应就是FAA与还原糖发生化学反应,生成类黑素、还原酮等物质,赋予食品独特的色泽和风味[6]。目前已知氨基酸的种类多至150多种,但常见的主要为20多种;氨基酸是人类身体代谢不可或缺的一种重要营养物质,按人体需求主要分为必需氨基酸(essential amino acid,EAA)、非必需氨基酸(nonessential amino acid,NEAA)和半必需氨基酸(semi-essential amino acid,SEAA)[7]。FAA中包括谷氨酸(Glu)、脯氨酸(Pro)、甘氨酸(Gly)等都是常用的食品添加剂,能在食物加工过程中产生鲜味、甜味、苦味等味觉效果[8]。目前大多采用化学计量学分析游离氨基酸在食品中的特征规律,已有辣椒[9]、蚕豆[10]、花粉[11]、黄花菜[4]、百合[12]等氨基酸成分及含量的研究报道。葛帅等[9]发现6种辣椒中鲜味氨基酸最为丰富,以Glu为核心氨基酸;ARES等[11]利用FAA的含量和种类判断花粉的地理来源及采收时期。炒菜薹是一种常见的家制美味菜肴,通过阐明菜薹中游离氨基酸的种类及含量的变化规律,有助于改善菜薹加工制品的品质和口感。然而,目前关于菜薹FAA的研究鲜见报道。
主成分分析(principal component analysis,PCA)是在尽可能避免数据信息损失的前提下,将多个相关变量通过线性变换为独立少数的综合变量,以实现降低数据的复杂性和提高数据的可视化[12−14]。近年来,PCA已得到广泛应用,如刘芹等[15]通过PCA科学评价不同香菇品种的氨基酸组分特征,明确了较好品质的香菇品种。诸多研究都有反映出PCA在解析不同品种农作物氨基酸品质特征规律的重要性,因此本研究通过高效液相色谱法检测16个不同品种菜薹的游离氨基酸,探究其种类及组分之间基本变化,并应用PCA和聚类分析法(hierarchical cluster analysis,HCA)进行系统分析,以期为菜薹品种选育、产品风味研发、资源利用提供理论支撑。
1. 材料与方法
1.1 材料与仪器
16种供试菜薹 油菜薹4种:早熟油菜薹1号、2号(XT-1、XT-2)、中熟油菜薹3号、4号(XT-3、XT-4),白菜薹7种:早熟白菜薹1号(HT-1)、中晚熟白菜薹3号(HT-3)、中熟小白菜薹5号(HT-5)、早中熟大白菜薹1号(QY-1)、晚熟青梗白菜薹2号(QY-2)、外观菜心型白菜薹1号、2号(CT-2、CT-4),紫红菜薹5种:早熟无蜡粉红菜薹1号、2号(LH-1、LH-2)、早中熟紫菜薹2号(ZT-2)、早熟紫菜薹2号(ZM-2)、早中熟有蜡粉红菜薹4号(HT-4),由湖南省农业科学院蔬菜研究所提供,均于2023年11月23日采收,新鲜菜薹采摘后当日转至实验室,4 ℃冰箱贮藏,取大小一致、无病虫害和机械损伤的茎叶部位用作实验研究;25种氨基酸(天冬氨酸Asp、谷氨酸Glu、天冬酰胺Asn、丝氨酸Ser、谷氨酰胺Gln、组氨酸His、甘氨酸Gly、苏氨酸Thr、瓜氨酸Cit、精氨酸Arg、丙氨酸Ala、酪氨酸Tyr、半胱氨酸Cys、缬氨酸Val、蛋氨酸Met、正缬氨酸Nva、色氨酸Trp、苯丙氨酸Phe、异亮氨酸Ile、赖氨酸Lys、亮氨酸Leu、羟脯氨酸Hyp、肌氨酸Sar、脯氨酸Pro、γ-氨基丁酸GABA)标准品 分析纯,美国Sigma公司。
KQ2200DE超声波清洗机 昆山市超声仪器有限公司;Thermo/X1R高速冷冻离心机 赛默飞世尔科技公司;Agilent 1100高效液相色谱仪 美国安捷伦科技有限公司;HH-8数显恒温水浴锅 上海力辰仪器科技有限公司。
1.2 实验方法
1.2.1 样品提取
参照李丛聪[16]的方法,准确称取1.0 g新鲜菜薹样品,分别置于10 mL离心管中,加入5 mL 0.01 mol/L盐酸,涡旋混匀,沸水浴15 min,超声10 min,4000 r/min离心5 min,取上清液于10 mL离心管中,重复以上步骤2次,合并上清液,用超纯水定容10 mL,混匀后用0.22 µm水系滤膜过滤。
1.2.2 氨基酸组成分析
色谱柱:ZORBAX Eclipse AAA(4.6 mm×150 mm,3.5 μm);检测信号:紫外338 nm(0~19 min),266 nm(19.01~25 min);流动相A:40 mol/L磷酸二氢钠(pH7.8);流动相B:乙腈:甲醇:水=45:45:10,流速1.0 mL/min;柱温45 ℃;进样量1 μL。
1.2.3 衍生化
采用安捷伦公司自动在线衍生化方法,一级氨基酸与邻苯二甲醛(OPA)、二级氨基酸与芴甲氧羰酰氯(FMOC)衍生后过柱检测。
1.2.4 氨基酸TAV计算
参考蒋四强等[10]的方法运算各游离氨基酸的TAV值,计算公式如下。
TAV=CT 式中:C为呈味氨基酸含量,mg/g;T为该氨基酸滋味阈值,mg/g。
1.3 数据处理
通过Microsoft Excel 2023对数据进行整合,并采用Origin 2022 软件内置插件(Heat Map With Dendrogram、Principal Component Analysis、Correlation Plot)进行相关性分析、主成分分析及聚类分析并绘图。每组实验重复三次,结果用平均值表示。
2. 结果与分析
2.1 菜薹游离氨基酸的组成及含量特征
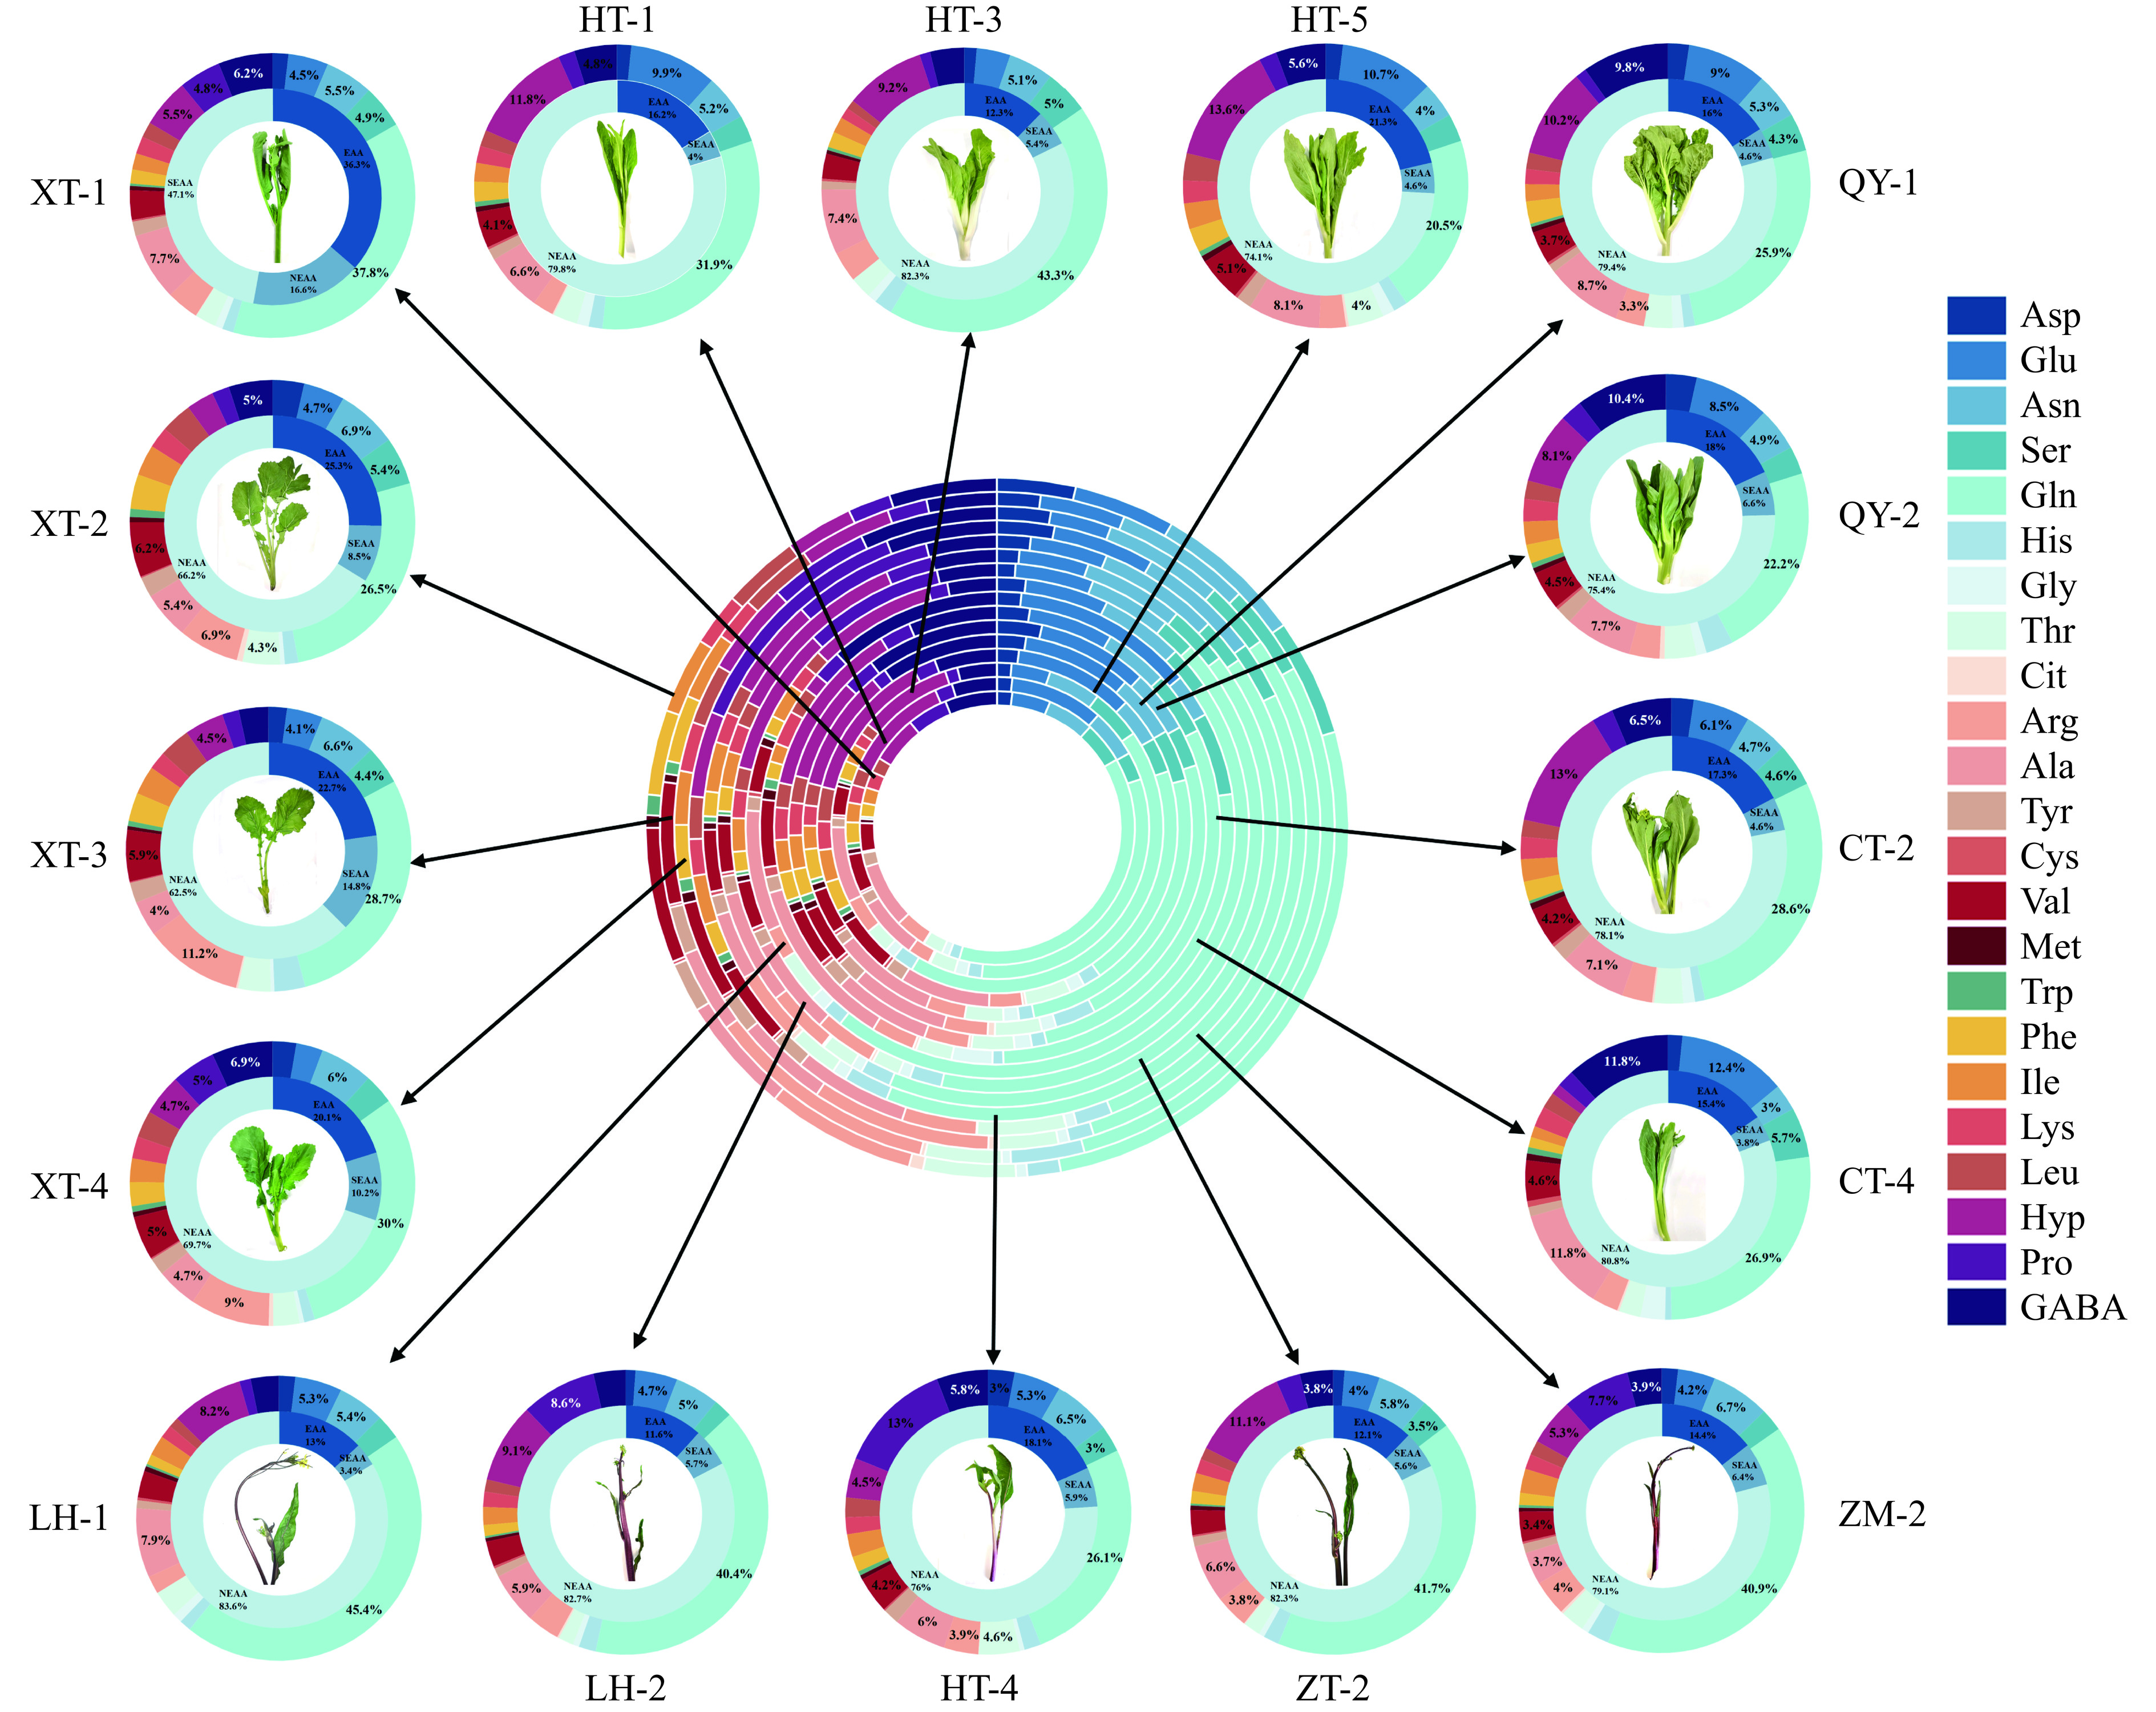
16种菜薹中共检出23种FAA,包含缬氨酸(Val)、苏氨酸(Thr)、色氨酸(Trp)、苯丙氨酸(Phe)、甲硫氨酸(Met)、亮氨酸(Leu)、赖氨酸(Lys)和异亮氨酸(Ile)8种EAA,组氨酸(His)和精氨酸(Arg)2种SEAA,脯氨酸(Pro)、甘氨酸(Gly)、谷氨酰胺(Gln)、谷氨酸(Glu)、天冬氨酸(Asp)、酪氨酸(Tyr)、丙氨酸(Ala)、γ-氨基丁酸(GABA)、瓜氨酸(Cit)、丝氨酸(Ser)、胱氨酸(Cys)、天冬酰胺(Asn)、羟脯氨酸(Hyp)13种NEAA。研究表明,除Cit在7种菜薹样品(XT-1、HT-1、HT-3、QY-1、CT-4、LH-1、HT-4)未检出,其他FAA在各品种菜薹均有呈现。宋廷宇等[17]通过氨基酸自动分析仪对不同地区的薹菜进行分析,共检测出17种FAA,与本研究相比,缺少了Gln、Gly、Thr、Cit、Val和GABA,这可能与品种选择、检测方法的差异相关。
不同品种菜薹各FAA种类及组成见表1。不同品种菜薹EAA、SEAA、NEAA均存在差异,菜薹总氨基酸含量(total free amino acid,TFAA)含量在1.30~6.77 mg/g,EAA含量占TFAA含量的11.61%~25.30%,与王申等[18]研究结果相似。16个菜薹品种间,XT-3中EAA、SEAA及TFAA含量均最高,分别为1.54、1.00、6.77 mg/g。NEAA含量最高的是ZT-2和ZM-2,均为4.55 mg/g。其中CT-4中EAA、SEAA、NEAA、TFAA含量均最低。菜薹中FAA平均含量从高到低依次是Gln>Hyp>Ala>Asn>Glu>GABA>Arg>Val>Pro>Ser>Thr>Ile>Asp>Phe>Leu>His>Lys>Tyr>Gly>Met>Trp>Cys>Cit,这在图1清晰可见。其中Gln含量占TFAA含量的33%,分别是Hyp、Ala、Asn含量的4、5、6倍。综合以上研究结果发现,同一地区栽培种植的不同品种菜薹之间氨基酸含量差异显著,具有丰富的品种多样性。从不同品种菜薹各氨基酸含量的变异系数看,Cit、Pro、Arg变异系数较大,表明菜薹中Cit、Pro含量在品种差异较大,Glu、Gly、Cys变异程度相对较小,说明其含量在菜薹品种间差异相对较小。各品种菜薹含有8种药用氨基酸(medicinal amino acid,MMA),其中Glu、Arg含量最为丰富,而Glu作为一种营养强化剂,具有降糖减脂、舒心解郁等功效[19]。日常适量补充Arg,也有助于降低高血压、预防冠状动脉疾病、改善糖尿病等问题[20]。
表 1 不同品种菜薹FAA组成Table 1. Contents of FAA in different Brassica campestris cultivars氨基酸(mg/g) 品种 平均值 标准差 变异系
数(%)XT-1 XT-2 XT-3 XT-4 HT-1 HT-3 HT-5 QY-1 QY-2 CT-2 CT-4 LH-1 LH-2 ZT-2 ZM-2 HT-4 EAA(8) Thr▲ 0.10ef 0.21b 0.25a 0.17c 0.07h 0.11de 0.08gh 0.10ef 0.09fg 0.07h 0.03i 0.12d 0.09fg 0.11de 0.16c 0.21b 0.12 0.06 49.59 Val▲ 0.14e 0.31b 0.40a 0.29bc 0.10f 0.13ef 0.10f 0.11f 0.11f 0.10f 0.06g 0.11f 0.15e 0.16e 0.20d 0.19d 0.17 0.09 55.39 Met▲ 0.02ab 0.03a 0.03a 0.03a 0.01c 0.02ab 0.01c 0.02ab 0.01c 0.02ab 0.01c 0.02ab 0.02ab 0.03a 0.02ab 0.02ab 0.02 0.01 29.93 Trp▲ 0.01c 0.05a 0.04ab 0.04ab 0.01c 0.02c 0.01c 0.01c 0.01c 0.01c 0.01c 0.01c 0.01c 0.01c 0.02c 0.02c 0.02 0.01 65.76 Phe▲☆ 0.07de 0.20b 0.22a 0.16c 0.06ef 0.08d 0.05g 0.08d 0.05g 0.05g 0.02h 0.04g 0.06f 0.08d 0.08d 0.08d 0.09 0.06 65.72 Ile▲ 0.08f 0.18b 0.22a 0.16c 0.05j 0.08f 0.06g 0.06g 0.06g 0.06g 0.02h 0.09e 0.10de 0.11d 0.16c 0.12d 0.10 0.05 54.28 Lys▲☆ 0.08cd 0.12b 0.14a 0.14a 0.05de 0.06d 0.05g 0.05de 0.06d 0.06d 0.03f 0.06d 0.09c 0.09c 0.10c 0.09c 0.08 0.03 42.66 Leu▲☆ 0.07cd 0.18b 0.24a 0.18b 0.05de 0.05de 0.06de 0.06de 0.05de 0.04ef 0.02g 0.04ef 0.07cd 0.08cd 0.09c 0.10c 0.09 0.06 69.84 SEAA(2) His▲ 0.05efg 0.08cd 0.24a 0.07de 0.04g 0.09c 0.03g 0.04g 0.08cd 0.03g 0.01h 0.05efg 0.10c 0.10c 0.14b 0.09d 0.08 0.05 70.53 Arg▲☆ 0.16g 0.35c 0.76a 0.52b 0.06i 0.15g 0.06i 0.10h 0.08h 0.08h 0.04i 0.08h 0.19f 0.21de 0.23d 0.18f 0.20 0.19 95.59 NEAA
(13)Asp▲☆ 0.08ef 0.18a 0.14c 0.16b 0.04hi 0.06g 0.04gh 0.07fg 0.09ef 0.06g 0.02i 0.07fg 0.06g 0.07g 0.11d 0.14c 0.09 0.05 53.47 Glu▲☆ 0.19ef 0.24bc 0.27a 0.18h 0.25b 0.17h 0.21de 0.28a 0.21fg 0.14i 0.16h 0.20de 0.24bc 0.22d 0.24bc 0.24bc 0.22 0.04 18.37 Gln▲ 1.60cd 1.34e 1.94b 1.75c 0.79f 1.94b 0.41hi 0.79f 0.54gh 0.67fg 0.35gh 1.71c 2.05b 2.30a 2.35a 1.20e 1.36 0.69 50.59 Gly▲☆ 0.04ab 0.03abc 0.03abc 0.03abc 0.03abc 0.05a 0.03abc 0.04ab 0.03abc 0.03abc 0.04ab 0.04ab 0.04ab 0.04ab 0.05a 0.02d 0.03 0.01 19.57 Pro▲ 0.20d 0.10f 0.13f 0.29c 0.05g 0.05g 0.04g 0.04g 0.06g 0.05g 0.03g 0.05g 0.43b 0.15e 0.44b 0.60a 0.17 0.18 104.96 Asn▲ 0.23g 0.35c 0.44a 0.35c 0.13jk 0.23g 0.08l 0.16i 0.12jk 0.11jk 0.04m 0.20h 0.26f 0.32d 0.38b 0.30e 0.23 0.12 51.49 Tyr▲☆ 0.07c 0.12b 0.16a 0.11b 0.03de 0.04de 0.03de 0.03de 0.05cd 0.04de 0.01e 0.03de 0.05cd 0.06cd 0.06cd 0.08c 0.06 0.04 62.34 Ser▲ 0.21cd 0.27b 0.30a 0.20cd 0.07l 0.22cd 0.06gh 0.13ef 0.08g 0.11f 0.07gh 0.11f 0.11f 0.19cd 0.15e 0.14e 0.15 0.07 48.33 Cit − 0.03ab 0.01c 0.03ab − − 0.01c − 0.01c 0.01c − − 0.01c 0.01c 0.02abc − 0.01 0.01 109.51 Ala▲ 0.33b 0.27cd 0.27cd 0.27cd 0.16g 0.33b 0.16g 0.27cd 0.19ef 0.17fg 0.15g 0.30c 0.30c 0.36a 0.21e 0.28cd 0.25 0.07 26.98 Cys▲ 0.01a 0.01a 0.01a 0.01a 0.01a 0.01a 0.01a 0.01a 0.01a 0.01a 0.01a 0.01a 0.01a 0.01a 0.01a 0.01a 0.01 0.00 22.62 Hyp 0.23f 0.16g 0.30d 0.27e 0.29de 0.41c 0.27e 0.31d 0.20fg 0.30d 0.02h 0.31d 0.46b 0.61a 0.31d 0.21fg 0.29 0.13 45.13 GABA 0.26cd 0.25cd 0.23de 0.40a 0.12hi 0.17fg 0.11hi 0.30b 0.25cd 0.15gh 0.15gh 0.12hi 0.18fg 0.21ef 0.22de 0.27bc 0.21 0.08 36.19 EAA 0.57fg 1.28b 1.54a 1.17c 0.40k 0.55gh 0.42jk 0.49i 0.44j 0.41jk 0.20l 0.49i 0.59f 0.67e 0.83d 0.83d 0.68 0.37 53.71 SEAA 0.21h 0.43c 1.00a 0.59b 0.10l 0.24g 0.09l 0.14ij 0.16i 0.11kl 0.05m 0.13jk 0.29ef 0.31e 0.37d 0.27f 0.28 0.24 85.30 NEAA 3.45e 3.35f 4.23b 4.05c 1.97i 3.68d 1.46k 2.43h 1.84j 1.85j 1.05l 3.15g 4.20b 4.55a 4.55a 3.49e 3.08 1.16 37.51 MAA 0.76f 1.40c 1.95a 1.48b 0.56j 0.66h 0.54j 0.70g 0.62i 0.49k 0.34k 0.57j 0.79f 0.84e 0.96d 0.94d 1.12 1.12 1.00 TFAA 4.23g 5.06d 6.77a 5.81b 2.47j 4.47f 1.97l 3.06i 2.44j 2.37k 1.30m 3.77h 5.08d 5.53c 5.75b 4.59e 4.04 1.61 39.90 EAA/TFAA(%) 13.48 25.30 22.75 20.14 16.19 12.30 21.32 16.01 18.03 17.30 15.38 13.00 11.61 12.12 14.43 18.08 16.83 22.98 134.61 注:−表示未检出;▲表示呈味氨基酸;☆表示药用氨基酸;同行小写字母不同表示差异显著(P<0.05)。 ![]() 图 1 不同品种菜薹FAA组成模式分析Figure 1. Composition patterns analysis of FAA in different Brassica campestris cultivars
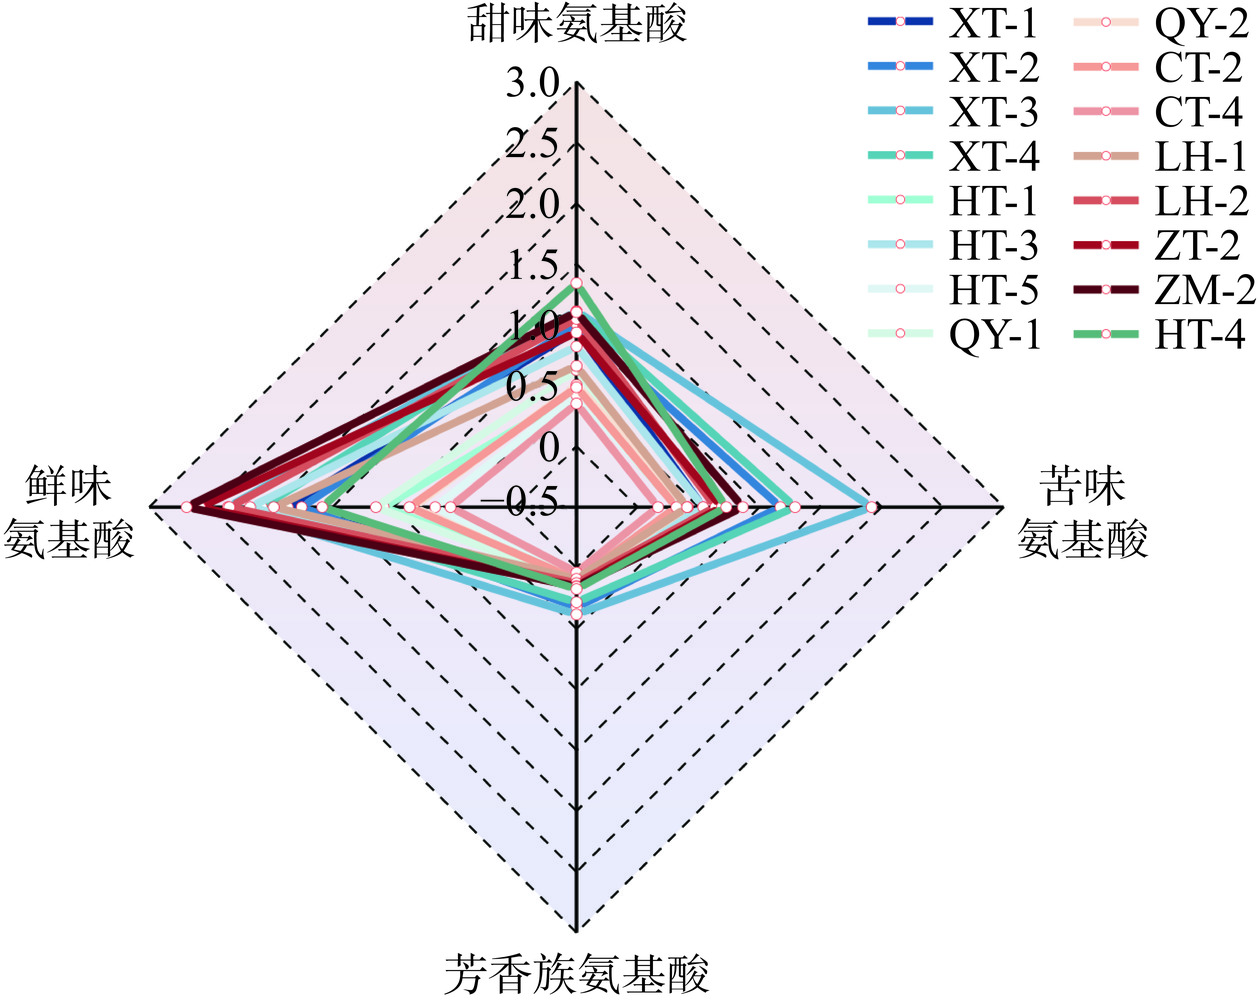
图 1 不同品种菜薹FAA组成模式分析Figure 1. Composition patterns analysis of FAA in different Brassica campestris cultivars2.2 菜薹中呈味氨基酸分析
游离氨基酸是食品呈味的重要成分,其通过刺激味蕾,使人产生鲜味、甜味、苦味等不同的滋味。根据FAA呈味特性,大体可将菜薹检测到的23种FAA分为鲜味氨基酸(Asp、Glu、Gln、Gly)、甜味氨基酸(Ser、Gly、Thr、Ala、Lys、Pro)苦味氨基酸(His、Arg、Val、Met、Ile、Leu、Trp)芳香族氨基酸(Tyr、Cys、Phe)[21]。如图2所示,菜薹中呈味氨基酸排名顺序为:鲜味氨基酸>苦味氨基酸>甜味氨基酸>芳香族氨基酸。鲜味氨基酸含量为0.53~2.69 mg/g,平均含量为1.66 mg/g。可见菜薹中的鲜味为主要风味,其中ZM-2(2.69 mg/g)、ZT-2(2.58 mg/g)、XT-3(2.35 mg/g)中的鲜味氨基酸含量较为明显,分别在呈味氨基酸总含量的占比为56.21%、59.34%、41.28%;甜味氨基酸含量为0.35~1.34 mg/g,平均值为0.81 mg/g。16种菜薹中HT-4(1.34 mg/g)、XT-3(1.11 mg/g)、XT-4(1.11 mg/g)的甜味氨基酸含量居于前三。苦味氨基酸含量为0.17~1.92 mg/g,而XT-3不仅鲜味、甜味突出,其苦味氨基酸含量(1.92 mg/g)也偏高,CT-4(0.17 mg/g)含量最低。芳香族氨基酸含量为0.04~0.38 mg/g,低于其他呈味氨基酸含量。通过分析16种菜薹各种呈味氨基酸含量,发现不同品种菜薹之间呈味氨基酸含量差异显著,然而鲜味和甜味突出的菜薹,其苦味氨基酸含量也不低。据此可见,尽管菜薹品种不一,但其呈味氨基酸构成模式相似,这些氨基酸通过协同作用体现出各类菜薹相一致的呈味特质。
![]() 图 2 不同品种菜薹呈味氨基酸组成模式分析Figure 2. Flavor amino acid composition patterns analysis of different Brassica campestris cultivars
图 2 不同品种菜薹呈味氨基酸组成模式分析Figure 2. Flavor amino acid composition patterns analysis of different Brassica campestris cultivars氨基酸的含量并不能决定其对菜薹的呈味特性,通常引用氨基酸的阈值来计算TAV以表示其对菜薹呈味的影响程度[22]。16种不同种质菜薹氨基酸的TAV见表2,TAV值大小代表相应氨基酸对菜薹呈味特性的贡献度,如TAV>1时,则表明该氨基酸对样品呈味有影响,若TAV<1时,即其对呈味无明显效果。鲜味氨基酸中对风味贡献最大的为Gln,除HT-1、HT-5、QY-1、QY-2、CT-2、CT-4外其他品种菜薹其TAV均大于1,说明Gln是菜薹鲜味的主要呈味物质,对食品的鲜香起着突出的作用[23]。甜味氨基酸中的Ala在各品种菜薹中TAV均小于1,但由于较低的阈值,且作为一种呈味增强剂,对菜薹的整体风味起到一种协调和改善的效果。苦味氨基酸以Val为主要氨基酸,TAV 平均值为 0.42,而 XT-3 中的 His、Arg 的 TAV 均大于 1,分别为 1.18 和 1.51,说明His、Arg两种氨基酸对XT-3风味的形成贡献显著,提供该菜薹突出的苦味特征。芳香族氨基酸中Tyr、Cys、Phe的TAV在各品种菜薹均小于1,表明芳香族氨基酸对菜薹的整体风味影响不大,但芳香族氨基酸在制药工业中越来越重要[24]。
表 2 不同品种菜薹呈味氨基酸TAV分析Table 2. TAV analysis of flavor amino acids in different Brassica campestris cultivars分类 氨基酸 呈味阈值
(mg/g)*TAV 总和 平均值 XT-1 XT-2 XT-3 XT-4 HT-1 HT-3 HT-5 QY-1 QY-2 CT-2 CT-4 LH-1 LH-2 ZT-2 ZM-2 HT-4 鲜味 Asp 1.00 0.08 0.18 0.14 0.16 0.04 0.06 0.04 0.07 0.09 0.06 0.02 0.07 0.06 0.07 0.11 0.14 Glu 0.30 0.64 0.78 0.91 0.59 0.82 0.57 0.71 0.92 0.69 0.48 0.54 0.67 0.80 0.73 0.81 0.82 Gln 1.20 1.33 1.11 1.62 1.45 0.66 1.62 0.34 0.66 0.45 0.56 0.29 1.42 1.71 1.91 1.96 1.00 总和 2.05 2.07 2.67 2.20 1.52 2.25 1.09 1.65 1.23 1.10 0.85 2.16 2.57 2.71 2.88 1.96 30.93 1.94 甜味 Ser 1.50 0.14 0.18 0.20 0.13 0.05 0.15 0.04 0.09 0.05 0.07 0.05 0.07 0.07 0.13 0.10 0.09 Gly 1.30 0.03 0.02 0.02 0.02 0.03 0.04 0.02 0.03 0.02 0.02 0.03 0.03 0.03 0.03 0.03 0.02 Thr 2.60 0.04 0.08 0.10 0.07 0.03 0.04 0.03 0.04 0.03 0.03 0.01 0.04 0.03 0.04 0.06 0.08 Ala 0.60 0.54 0.45 0.45 0.45 0.27 0.56 0.27 0.44 0.31 0.28 0.26 0.49 0.50 0.60 0.35 0.46 Lys 0.50 0.17 0.25 0.28 0.29 0.10 0.11 0.10 0.10 0.12 0.11 0.06 0.11 0.17 0.18 0.20 0.18 Pro 3.00 0.07 0.03 0.04 0.10 0.02 0.02 0.01 0.01 0.02 0.02 0.01 0.02 0.14 0.05 0.15 0.20 总和 0.99 1.01 1.09 1.06 0.50 0.92 0.47 0.71 0.55 0.53 0.42 0.76 0.94 1.03 0.89 1.03 12.92 0.82 苦味 His 0.20 0.27 0.39 1.18 0.36 0.20 0.47 0.16 0.19 0.38 0.13 0.05 0.25 0.49 0.49 0.71 0.44 Arg 0.50 0.31 0.69 1.51 1.05 0.12 0.31 0.12 0.20 0.17 0.15 0.08 0.15 0.37 0.42 0.46 0.36 Val 0.40 0.36 0.79 0.99 0.72 0.26 0.32 0.25 0.29 0.27 0.24 0.15 0.29 0.37 0.39 0.49 0.48 Met 0.30 0.07 0.10 0.09 0.11 0.05 0.06 0.05 0.06 0.05 0.05 0.03 0.07 0.06 0.09 0.08 0.07 Ile 0.90 0.09 0.20 0.24 0.17 0.06 0.09 0.06 0.07 0.07 0.06 0.02 0.10 0.11 0.12 0.18 0.13 Leu 1.90 0.04 0.09 0.13 0.09 0.02 0.02 0.03 0.03 0.03 0.02 0.01 0.02 0.04 0.04 0.05 0.05 Trp 0.90 0.01 0.05 0.05 0.04 0.02 0.02 0.01 0.01 0.02 0.01 0.01 0.01 0.01 0.01 0.02 0.03 总和 1.15 2.31 4.19 2.54 0.73 1.29 0.68 0.85 0.99 0.66 0.35 0.89 1.45 1.56 1.99 1.56 23.21 1.46 芳香族 Tyr 2.60 0.03 0.04 0.06 0.04 0.01 0.02 0.01 0.01 0.02 0.02 0.01 0.01 0.02 0.02 0.02 0.03 Cys 0.02 0.42 0.41 0.47 0.53 0.35 0.63 0.37 0.5 0.38 0.40 0.44 0.59 0.65 0.59 0.70 0.43 Phe 0.90 0.08 0.22 0.24 0.18 0.06 0.09 0.06 0.09 0.06 0.05 0.02 0.05 0.07 0.09 0.09 0.09 总和 0.53 0.67 0.77 0.75 0.42 0.74 0.44 0.6 0.46 0.47 0.47 0.65 0.74 0.70 0.81 0.55 9.71 0.61 注:*依据部分参考文献[9−12]。 2.3 菜薹中游离氨基酸相关性分析
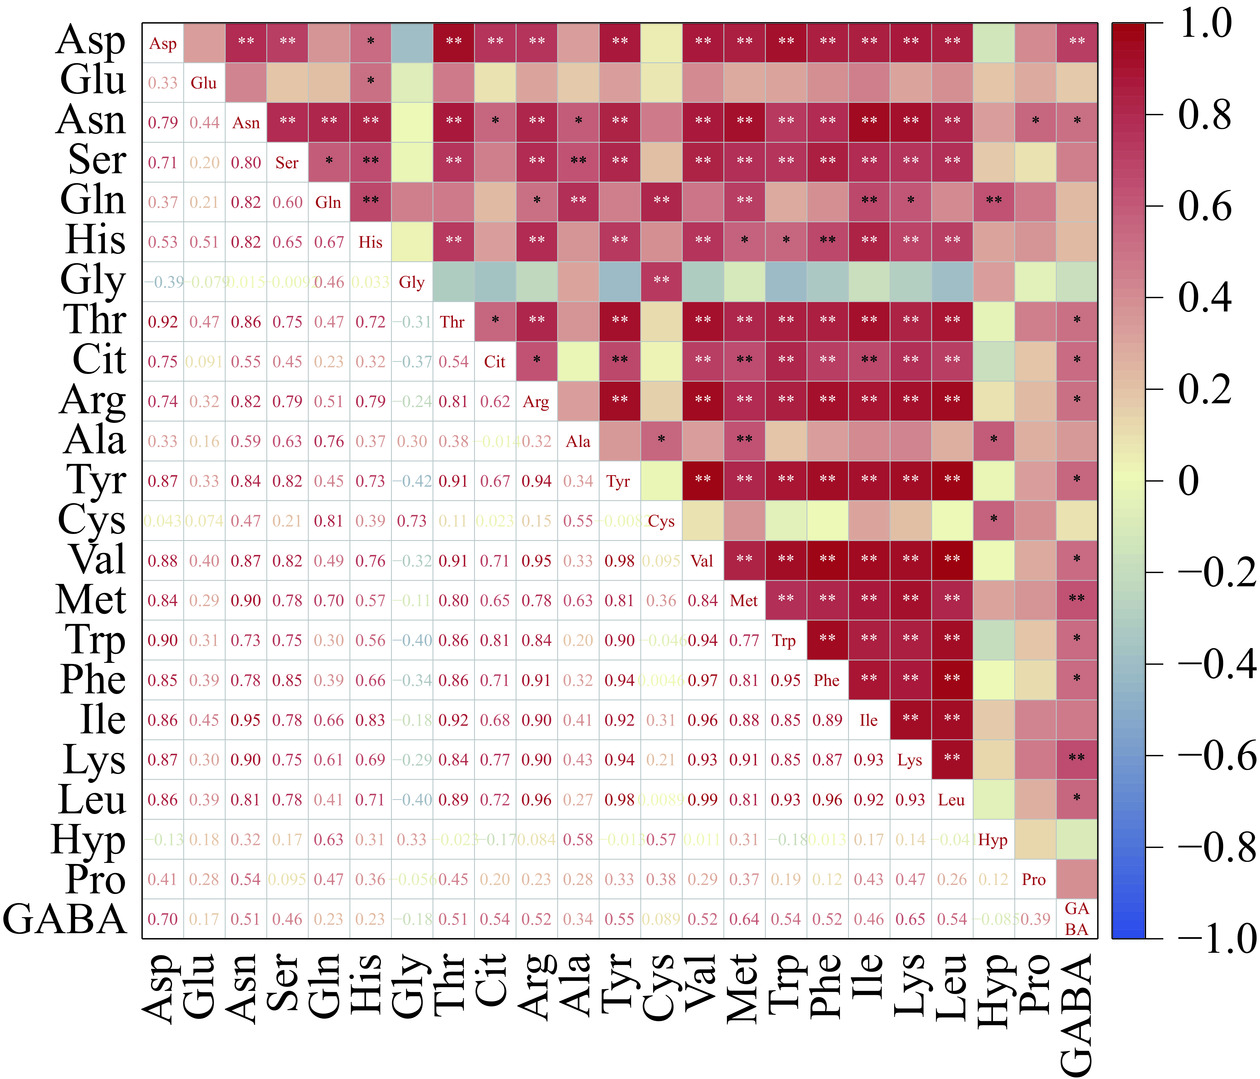
对菜薹中23种氨基酸进行相关性分析,结果如图3所示。大部分氨基酸之间存在显著正相关(P<0.05),无显著负相关,原远等[25]研究也发现菜薹各氨基酸种类含量间相关性较强。Asp、Asn、Ser、His、Thr、Arg、Tyr、Val、Met、Trp、Phe、Ile、Lys、Leu这14种氨基酸间均呈显著正相关(P<0.05);GABA与Asp、Met、Lys间呈极显著正相关(P<0.01),与Asn、Thr、Cit、Arg、Tyr、Val、Trp、Phe、Leu间呈显著正相关(P<0.05);Gly仅与Cys呈极显著正相关(P<0.01)。结果表明菜薹各FAA之间相关性较好,因此可借助主成分分析对不同菜薹品种进行综合评估。
![]() 图 3 不同品种菜薹中FAA指标相关性分析注:*P<0.05,**P<0.01。Figure 3. Correlation analysis between FAA indexes in Brassica campestris cultivars
图 3 不同品种菜薹中FAA指标相关性分析注:*P<0.05,**P<0.01。Figure 3. Correlation analysis between FAA indexes in Brassica campestris cultivars2.4 菜薹中游离氨基酸主成分分析
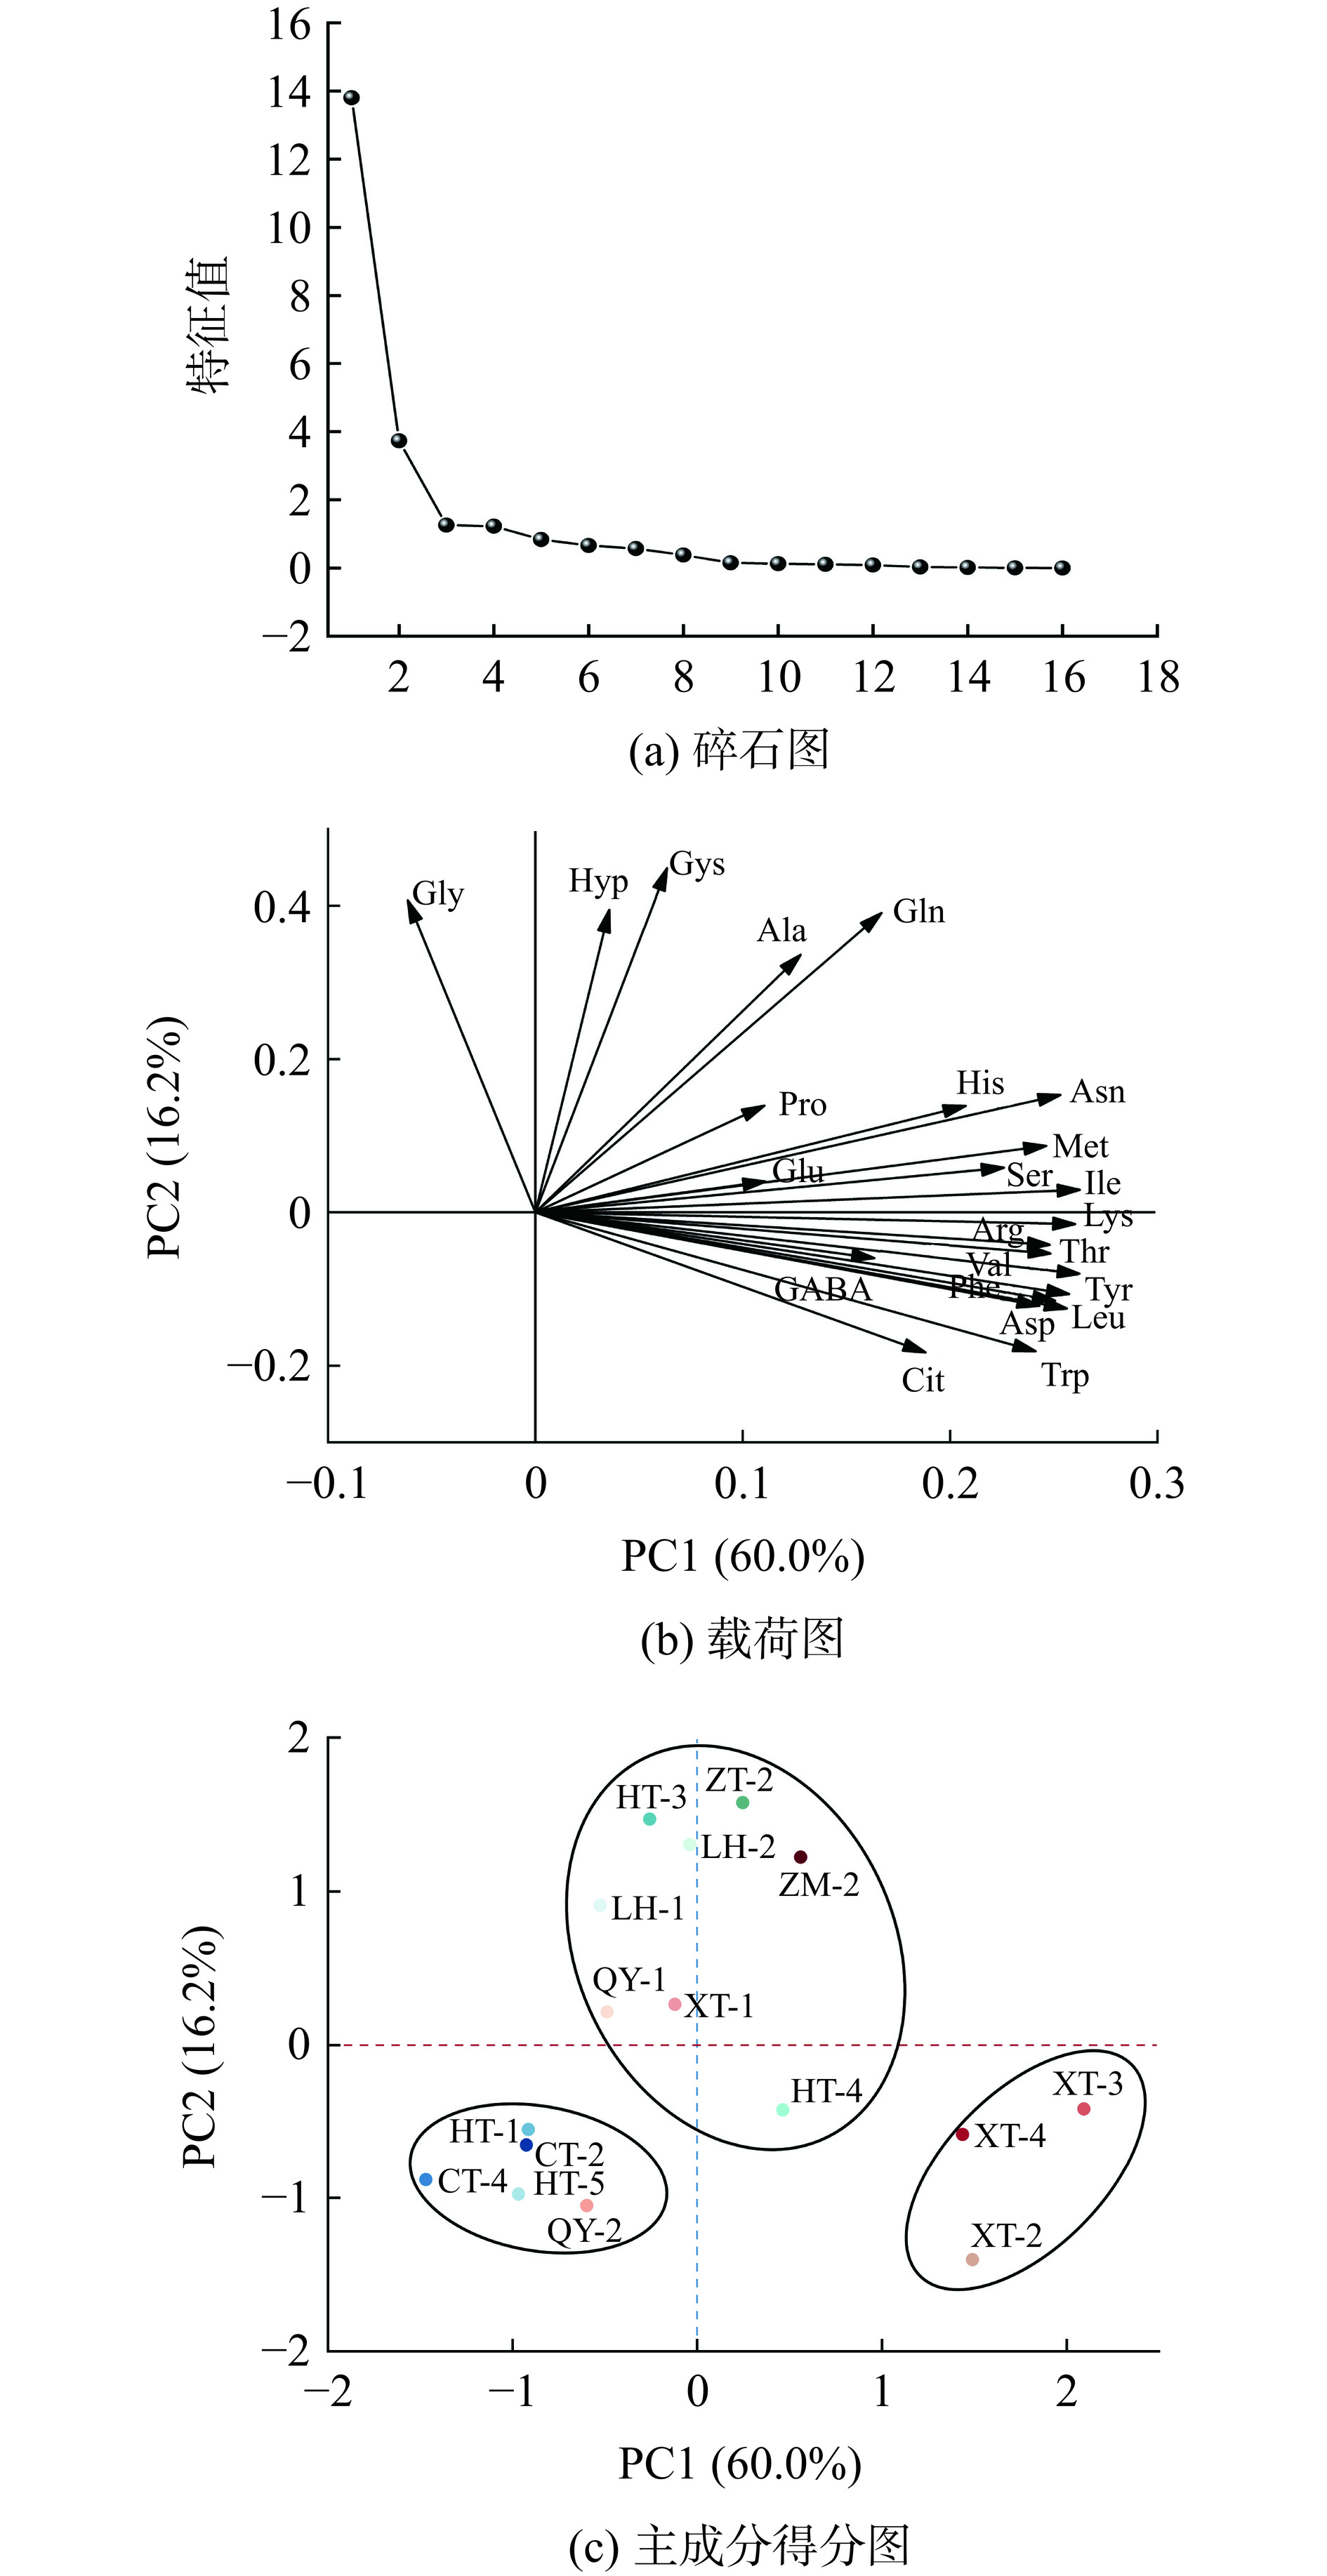
主成分分析是一种通过正交变换对数据实现线性降维的方法,在尽可能保留原始数据信息的原则下,将具有相关性的多个变量简化为少数独立的综合变量,从而更有效地将数据可视化[26]。如表3所示,对菜薹中23种FAA采用PCA的方法,取特征值大于1的数据,并结合图4(a)碎石图,共获取4个PC,累计方差贡献率为87.022%,总体覆盖了所有变量的原始数据,符合对不同品种菜薹进行综合评价的依据,因此以前4个主成分作为4个相互独立的综合性变量代替23种FAA,对不同品种菜薹FAA品质进行全面分析。
表 3 主成分的特征值和贡献率Table 3. Eigenvalues and contribution rates of principal components主成分 特征值 贡献率(%) 累计贡献率(%) 1 13.800 59.999 59.999 2 3.730 16.219 76.218 3 1.260 5.478 81.696 4 1.225 5.326 87.022 5 0.838 3.642 90.664 如表4、图4(b)载荷图所示,载荷值直接体现各氨基酸指标对各主成分的影响程度和方向,数值大小代表影响程度深浅,正负用来区别影响的方向[27−28]。PC1中载荷值较大的FAA有Asp、Asn、Ser、Gln、His、Thr、Cit、Arg、Tyr、Val、Met、Trp、Phe、Ile、Lys、Leu、GABA,其中Asp、Asn、Thr、Arg、Tyr、Val、Met、Phe、Ile、Lys、Leu,载荷值均大于0.9,与PC1相关性较强,同时主成分载荷值大小可以决定氨基酸含量的高低,故这些氨基酸可作为菜薹的特征FAA,而ZHANG等[29]结果表明发酵菜薹中的主要特征FAA分别是Gln、Asn、Pro、Gly。由于PC1方差贡献率为59.999%,远大于PC2、PC3、PC3这3个主成分累计方差贡献率(27%),表明PC1对菜薹FAA品质具有很强的影响效应。
表 4 主成分的特征向量和载荷值Table 4. Eigenvectors and loading values of principal componentsFAA PC1 PC2 PC3 PC4 特征
向量载荷 特征
向量载荷 特征
向量载荷 特征
向量载荷 Asp 0.243 0.903 −0.122 −0.236 0.205 0.230 0.033 0.037 Glu 0.111 0.412 0.040 0.078 −0.342 −0.384 0.573 0.634 Asn 0.253 0.941 0.153 0.296 0.013 0.015 0.083 0.092 Ser 0.226 0.840 0.058 0.113 −0.139 −0.157 −0.338 −0.374 Gln 0.167 0.620 0.390 0.754 0.035 0.039 −0.045 −0.049 His 0.208 0.771 0.139 0.268 −0.338 −0.380 0.197 0.219 Gly −0.062 −0.228 0.407 0.786 −0.010 −0.011 −0.179 −0.198 Thr 0.248 0.923 −0.054 −0.104 −0.041 −0.046 0.155 0.172 Cit 0.188 0.699 −0.183 −0.353 0.252 0.283 −0.126 −0.140 Arg 0.248 0.922 −0.043 −0.082 −0.151 −0.169 −0.085 −0.094 Ala 0.128 0.475 0.336 0.649 0.081 0.090 −0.201 −0.223 Tyr 0.257 0.956 −0.107 −0.206 −0.068 −0.077 −0.019 −0.021 Cys 0.063 0.236 0.449 0.867 0.156 0.175 −0.007 −0.008 Val 0.263 0.975 −0.080 −0.155 −0.111 −0.124 −0.020 −0.023 Met 0.246 0.915 0.087 0.168 0.155 0.174 −0.125 −0.138 Trp 0.241 0.896 −0.181 −0.350 −0.012 −0.014 −0.097 −0.107 Phe 0.251 0.931 −0.115 −0.223 −0.163 −0.183 −0.140 −0.155 Ile 0.263 0.975 0.030 0.057 −0.079 −0.089 0.074 0.082 Lys 0.260 0.967 −0.016 −0.030 0.129 0.144 −0.009 −0.010 Leu 0.256 0.952 −0.126 −0.242 −0.103 −0.116 −0.018 −0.020 Hyp 0.036 0.132 0.395 0.762 −0.171 −0.192 −0.026 −0.028 Pro 0.110 0.410 0.139 0.269 0.444 0.499 0.580 0.641 GABA 0.163 0.607 −0.060 −0.116 0.509 0.571 −0.029 −0.032 不同品种菜薹PCA分析如图4(c)主成分得分图所示。从图可知,16个菜薹品种聚集在不同的3个区域。其中ZT-2、ZM-2、LH-1、LH-2、XT-1、HT-3、QY-1、HT-4位于第一、二、四象限,HT-1、CT-2、CT-4、HT-5、QY-2聚集于第三象限,XT-2、XT-3、XT-4堆集于第四象限,距离越近则表明相互品质较为相似[28]。此外,FAA主要分布在第一、四象限,如Gln、Hyp、Ala、Asn等聚集在第一象限,且在ZT-2、ZM-2中含量丰富,表明这些FAA对ZT-2、ZM-2分布有积极影响。第二象限仅有Gly,与PC1呈负相关,而其他FAA均与PC1呈正向关联。
2.5 油菜薹游离氨基酸综合评价
如表3 所示,前 4 个 PC 累计方差贡献率为 87.022%,符合对不同品种菜薹进行综合评价的依据。通过主成分的特征向量推导出菜薹中FAA的前4个PC的方程表达式如下:
F1 = 0.243X1 + 0.111X2 + 0.253X3 + 0.226X4 +…+ 0.256X20 + 0.036X21 + 0.110X22 + 0.163X23
F2 = −0.122X1 + 0.040X2 + 0.153X3 + 0.058X4 +…−0.126X20 + 0.395X21 + 0.139X22 − 0.600X23
F3 = 0.205X1 − 0.342X2 + 0.013X3 − 0.139X4 +…−0.103X20 − 0.171X21 + 0.444X22 + 0.509X23
F4 = 0.033X1 + 0.573X2 + 0.083X3 − 0.338X4 +…−0.018X20 − 0.026X21 + 0.580X22 − 0.029X23
以各菜薹品种主成分相应的贡献率作为权重计算,对4个主成分进行加权求和,得到菜薹中FAA综合评价方程式:F=0.600F1+0.162F2+0.055F3+0.053F4。各品种菜薹综合得分如表5所示,F值越大,说明该品种菜薹FAA综合品质较优。由表5可知,第一、二、三、四主成分得分最高的分别为XT-3、ZT-2、XT-4、HT-4,说明这些组分分别对XT-3、ZT-2、XT-4、HT-4的FAA品质影响最大。各品种菜薹FAA品质排名从高至低依次为XT-3、XT-4、ZM-2、XT-2、HT-4、ZT-2、LH-2、HT-3、XT-1、LH-1、QY-1、QY-2、HT-1、CT-2、HT-5、CT-4。整体来看,前3个品种XT-3、XT-4、ZM-2综合得分均大于0.5,表明其FAA综合品质较好,后3个品种CT-2、HT-5、CT-4综合得分偏低,分别为−0.695、−0.762、−1.038,品质相对较差。
表 5 不同品种菜薹FAA主成分综合得分和排名Table 5. Comprehensive scores and rankings of FAA main components of different cultivars of Brassica campestris品种 F1 F2 F3 F4 F 排名 XT-1 −0.119 0.262 0.616 −0.701 −0.033 9 XT-2 1.492 −1.405 0.080 −0.868 0.625 4 XT-3 2.094 −0.419 −2.482 0.191 1.062 1 XT-4 1.438 −0.585 2.094 −1.075 0.825 2 HT-1 −0.912 −0.551 −1.122 0.647 −0.664 13 HT-3 −0.257 1.468 −0.432 −1.582 −0.024 8 HT-5 −0.968 −0.977 −0.823 0.416 −0.762 15 QY-1 −0.487 0.213 −0.086 0.314 −0.245 11 QY-2 −0.596 −1.051 0.334 0.324 −0.493 12 CT-2 −0.924 −0.654 0.100 −0.761 −0.695 14 CT-4 −1.470 −0.881 0.287 −0.541 −1.038 16 LH-1 −0.524 0.908 −0.266 −0.452 −0.206 10 LH-2 −0.038 1.301 0.336 1.160 0.269 7 ZT-2 0.247 1.576 −0.290 −0.551 0.359 6 ZM-2 0.560 1.221 0.607 1.243 0.634 3 HT-4 0.464 −0.425 1.046 2.235 0.386 5 2.6 不同品种菜薹聚类分析
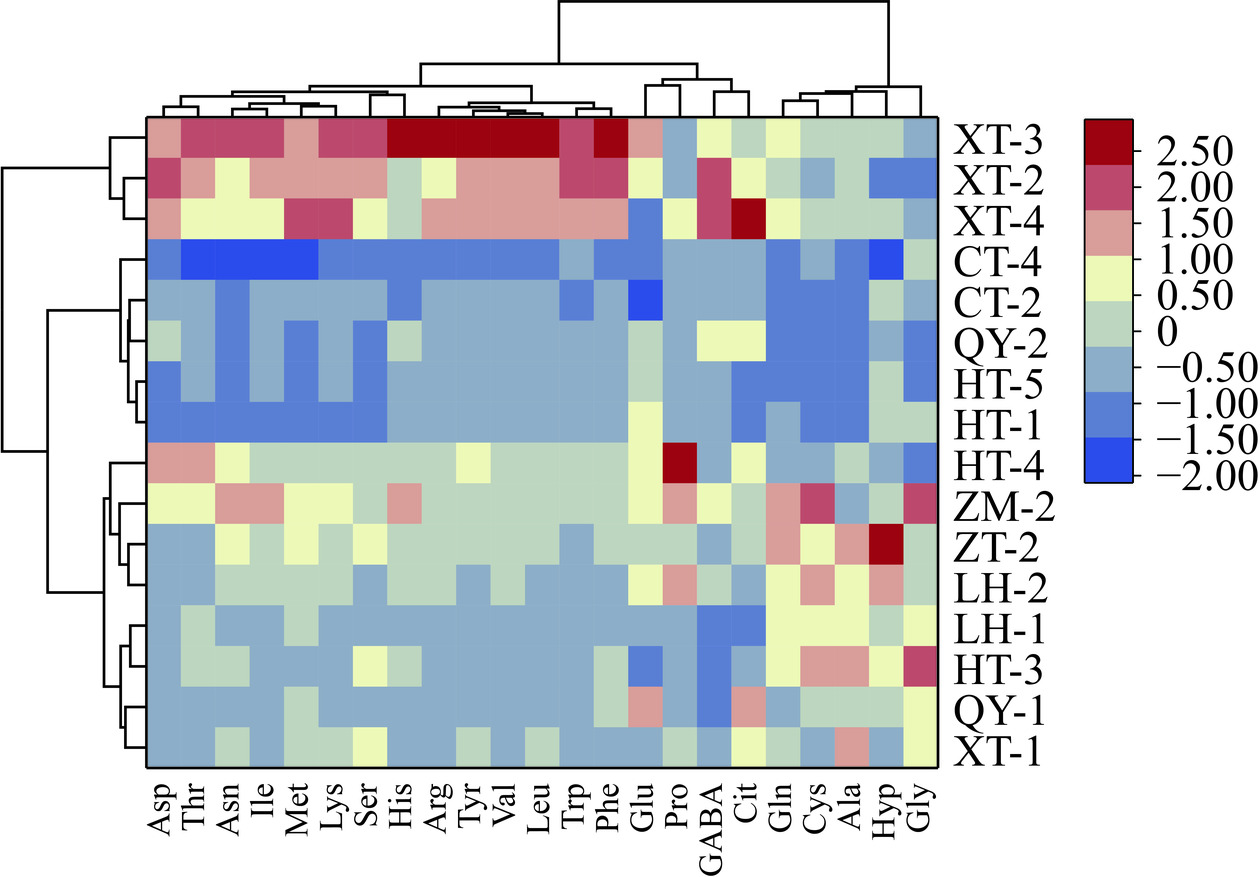
为了剖析菜薹FAA差异特征,将23种FAA含量通过标准化处理,采用Ward最小方差和欧式距离法对不同品种菜薹进行系统聚类[30]。如图5所示,色块颜色深浅代表FAA含量高低,聚为同类则反映其品质相近。16种菜薹分成3类,第1类包含XT-2、XT-3、XT-4,第2类包含CT-4、QY-2、CT-2、HT-5、HT-1,第3类包含HT-4、ZM-2、QY-1、ZT-2、LH-2、LH-1、HT-3、XT-1。聚类结果与之前的主成分分析结果相符,证实聚类分析确切可靠,能很好区分菜薹不同种质间的品质特征。23种游离氨基酸可划分为2类:第1类氨基酸为Gln、Cys、Ala、Hyp、Gly,这一类主要为第3类菜薹中丰富的呈味氨基酸,即归纳为同类。第2类氨基酸为Asp、Thr、Arg、Tyr、Val、Leu、Phe、Trp、Asn、Ile、Lys、Met、Ser、His、Cit、GABA、Glu、Pro,在第1类菜薹中含量较高,且均为第一主成分的关键贡献氨基酸,其中Phe、Lys、Leu、Arg、Glu、Gly、Tyr是MAA。这些氨基酸之间的相关性与图3的结果一致。因此,聚类分析高效可信,可为菜薹的品种选育及其氨基酸综合利用提供科学指南。
![]() 图 5 不同品种菜薹聚类分析Figure 5. Cluster analysis of different varieties of Brassica campestris
图 5 不同品种菜薹聚类分析Figure 5. Cluster analysis of different varieties of Brassica campestris3. 结论
本研究基于高效液相色谱法并结合多元统计方法,对16个不同菜薹品种FAA进行了综合评估。研究发现,16种菜薹品种FAA含量丰富,TFAA平均值为4.04 mg/g,以油菜薹XT-3的TFAA含量最高,白菜薹CT-4浓度最低。各菜薹共检测出22~23种FAA,其中Cit在部分菜薹品种未检出。不同品种菜薹 EAA、SEAA、NEAA、MAA之间差异显著,其含量从高到低为NEAA>MAA>EAA>SEAA,其中EAA占TFAA的比例为11.61%~25.30%。此外,各菜薹样品中均存在8种MAA且含量偏高,有望开发为药用资源。味道强度值显示鲜味是菜薹的主要呈味特征,其次是苦味和甜味。Gln是关键呈味氨基酸,在大部分菜薹品种中的TAV均大于1,平均值为1.13,赋予菜薹鲜香脆爽的口感。不同品种菜薹FAA间相关性较好,大部分氨基酸之间存在显著正相关(P<0.05),能有效分析各品种FAA品质特征及差异性。PCA与HCA结果表明,可将16种菜薹划分为3类,通过构造综合评价模型F=0.600F1+0.162F2+0.055F3+0.053F4,将菜薹FAA综合品质从高到低依次排为XT-3、XT-4、ZM-2、XT-2、HT-4、ZT-2、LH-2、HT-3、XT-1、LH-1、QY-1、QY-2、HT-1、CT-2、HT-5、CT-4。其中XT-2、XT-3、XT-4属于第1类菜薹,表明该类FAA品质相对较好,CT-2、CT-4、HT-1、HT-5、QY-2为第2类菜薹,反映该类FAA整体品质较差。本研究表明不同品种菜薹FAA品质差异显著,为菜薹氨基酸品质研究、种质选育及产品开发提供一定的理论支撑。
-
![]()
图 1 不同品种菜薹FAA组成模式分析
Figure 1. Composition patterns analysis of FAA in different Brassica campestris cultivars
![]()
图 2 不同品种菜薹呈味氨基酸组成模式分析
Figure 2. Flavor amino acid composition patterns analysis of different Brassica campestris cultivars
![]()
图 3 不同品种菜薹中FAA指标相关性分析
注:*P<0.05,**P<0.01。
Figure 3. Correlation analysis between FAA indexes in Brassica campestris cultivars
![]()
图 5 不同品种菜薹聚类分析
Figure 5. Cluster analysis of different varieties of Brassica campestris
表 1 不同品种菜薹FAA组成
Table 1 Contents of FAA in different Brassica campestris cultivars
氨基酸(mg/g) 品种 平均值 标准差 变异系
数(%)XT-1 XT-2 XT-3 XT-4 HT-1 HT-3 HT-5 QY-1 QY-2 CT-2 CT-4 LH-1 LH-2 ZT-2 ZM-2 HT-4 EAA(8) Thr▲ 0.10ef 0.21b 0.25a 0.17c 0.07h 0.11de 0.08gh 0.10ef 0.09fg 0.07h 0.03i 0.12d 0.09fg 0.11de 0.16c 0.21b 0.12 0.06 49.59 Val▲ 0.14e 0.31b 0.40a 0.29bc 0.10f 0.13ef 0.10f 0.11f 0.11f 0.10f 0.06g 0.11f 0.15e 0.16e 0.20d 0.19d 0.17 0.09 55.39 Met▲ 0.02ab 0.03a 0.03a 0.03a 0.01c 0.02ab 0.01c 0.02ab 0.01c 0.02ab 0.01c 0.02ab 0.02ab 0.03a 0.02ab 0.02ab 0.02 0.01 29.93 Trp▲ 0.01c 0.05a 0.04ab 0.04ab 0.01c 0.02c 0.01c 0.01c 0.01c 0.01c 0.01c 0.01c 0.01c 0.01c 0.02c 0.02c 0.02 0.01 65.76 Phe▲☆ 0.07de 0.20b 0.22a 0.16c 0.06ef 0.08d 0.05g 0.08d 0.05g 0.05g 0.02h 0.04g 0.06f 0.08d 0.08d 0.08d 0.09 0.06 65.72 Ile▲ 0.08f 0.18b 0.22a 0.16c 0.05j 0.08f 0.06g 0.06g 0.06g 0.06g 0.02h 0.09e 0.10de 0.11d 0.16c 0.12d 0.10 0.05 54.28 Lys▲☆ 0.08cd 0.12b 0.14a 0.14a 0.05de 0.06d 0.05g 0.05de 0.06d 0.06d 0.03f 0.06d 0.09c 0.09c 0.10c 0.09c 0.08 0.03 42.66 Leu▲☆ 0.07cd 0.18b 0.24a 0.18b 0.05de 0.05de 0.06de 0.06de 0.05de 0.04ef 0.02g 0.04ef 0.07cd 0.08cd 0.09c 0.10c 0.09 0.06 69.84 SEAA(2) His▲ 0.05efg 0.08cd 0.24a 0.07de 0.04g 0.09c 0.03g 0.04g 0.08cd 0.03g 0.01h 0.05efg 0.10c 0.10c 0.14b 0.09d 0.08 0.05 70.53 Arg▲☆ 0.16g 0.35c 0.76a 0.52b 0.06i 0.15g 0.06i 0.10h 0.08h 0.08h 0.04i 0.08h 0.19f 0.21de 0.23d 0.18f 0.20 0.19 95.59 NEAA
(13)Asp▲☆ 0.08ef 0.18a 0.14c 0.16b 0.04hi 0.06g 0.04gh 0.07fg 0.09ef 0.06g 0.02i 0.07fg 0.06g 0.07g 0.11d 0.14c 0.09 0.05 53.47 Glu▲☆ 0.19ef 0.24bc 0.27a 0.18h 0.25b 0.17h 0.21de 0.28a 0.21fg 0.14i 0.16h 0.20de 0.24bc 0.22d 0.24bc 0.24bc 0.22 0.04 18.37 Gln▲ 1.60cd 1.34e 1.94b 1.75c 0.79f 1.94b 0.41hi 0.79f 0.54gh 0.67fg 0.35gh 1.71c 2.05b 2.30a 2.35a 1.20e 1.36 0.69 50.59 Gly▲☆ 0.04ab 0.03abc 0.03abc 0.03abc 0.03abc 0.05a 0.03abc 0.04ab 0.03abc 0.03abc 0.04ab 0.04ab 0.04ab 0.04ab 0.05a 0.02d 0.03 0.01 19.57 Pro▲ 0.20d 0.10f 0.13f 0.29c 0.05g 0.05g 0.04g 0.04g 0.06g 0.05g 0.03g 0.05g 0.43b 0.15e 0.44b 0.60a 0.17 0.18 104.96 Asn▲ 0.23g 0.35c 0.44a 0.35c 0.13jk 0.23g 0.08l 0.16i 0.12jk 0.11jk 0.04m 0.20h 0.26f 0.32d 0.38b 0.30e 0.23 0.12 51.49 Tyr▲☆ 0.07c 0.12b 0.16a 0.11b 0.03de 0.04de 0.03de 0.03de 0.05cd 0.04de 0.01e 0.03de 0.05cd 0.06cd 0.06cd 0.08c 0.06 0.04 62.34 Ser▲ 0.21cd 0.27b 0.30a 0.20cd 0.07l 0.22cd 0.06gh 0.13ef 0.08g 0.11f 0.07gh 0.11f 0.11f 0.19cd 0.15e 0.14e 0.15 0.07 48.33 Cit − 0.03ab 0.01c 0.03ab − − 0.01c − 0.01c 0.01c − − 0.01c 0.01c 0.02abc − 0.01 0.01 109.51 Ala▲ 0.33b 0.27cd 0.27cd 0.27cd 0.16g 0.33b 0.16g 0.27cd 0.19ef 0.17fg 0.15g 0.30c 0.30c 0.36a 0.21e 0.28cd 0.25 0.07 26.98 Cys▲ 0.01a 0.01a 0.01a 0.01a 0.01a 0.01a 0.01a 0.01a 0.01a 0.01a 0.01a 0.01a 0.01a 0.01a 0.01a 0.01a 0.01 0.00 22.62 Hyp 0.23f 0.16g 0.30d 0.27e 0.29de 0.41c 0.27e 0.31d 0.20fg 0.30d 0.02h 0.31d 0.46b 0.61a 0.31d 0.21fg 0.29 0.13 45.13 GABA 0.26cd 0.25cd 0.23de 0.40a 0.12hi 0.17fg 0.11hi 0.30b 0.25cd 0.15gh 0.15gh 0.12hi 0.18fg 0.21ef 0.22de 0.27bc 0.21 0.08 36.19 EAA 0.57fg 1.28b 1.54a 1.17c 0.40k 0.55gh 0.42jk 0.49i 0.44j 0.41jk 0.20l 0.49i 0.59f 0.67e 0.83d 0.83d 0.68 0.37 53.71 SEAA 0.21h 0.43c 1.00a 0.59b 0.10l 0.24g 0.09l 0.14ij 0.16i 0.11kl 0.05m 0.13jk 0.29ef 0.31e 0.37d 0.27f 0.28 0.24 85.30 NEAA 3.45e 3.35f 4.23b 4.05c 1.97i 3.68d 1.46k 2.43h 1.84j 1.85j 1.05l 3.15g 4.20b 4.55a 4.55a 3.49e 3.08 1.16 37.51 MAA 0.76f 1.40c 1.95a 1.48b 0.56j 0.66h 0.54j 0.70g 0.62i 0.49k 0.34k 0.57j 0.79f 0.84e 0.96d 0.94d 1.12 1.12 1.00 TFAA 4.23g 5.06d 6.77a 5.81b 2.47j 4.47f 1.97l 3.06i 2.44j 2.37k 1.30m 3.77h 5.08d 5.53c 5.75b 4.59e 4.04 1.61 39.90 EAA/TFAA(%) 13.48 25.30 22.75 20.14 16.19 12.30 21.32 16.01 18.03 17.30 15.38 13.00 11.61 12.12 14.43 18.08 16.83 22.98 134.61 注:−表示未检出;▲表示呈味氨基酸;☆表示药用氨基酸;同行小写字母不同表示差异显著(P<0.05)。  下载: 导出CSV
表 2 不同品种菜薹呈味氨基酸TAV分析
Table 2 TAV analysis of flavor amino acids in different Brassica campestris cultivars
分类 氨基酸 呈味阈值
(mg/g)*TAV 总和 平均值 XT-1 XT-2 XT-3 XT-4 HT-1 HT-3 HT-5 QY-1 QY-2 CT-2 CT-4 LH-1 LH-2 ZT-2 ZM-2 HT-4 鲜味 Asp 1.00 0.08 0.18 0.14 0.16 0.04 0.06 0.04 0.07 0.09 0.06 0.02 0.07 0.06 0.07 0.11 0.14 Glu 0.30 0.64 0.78 0.91 0.59 0.82 0.57 0.71 0.92 0.69 0.48 0.54 0.67 0.80 0.73 0.81 0.82 Gln 1.20 1.33 1.11 1.62 1.45 0.66 1.62 0.34 0.66 0.45 0.56 0.29 1.42 1.71 1.91 1.96 1.00 总和 2.05 2.07 2.67 2.20 1.52 2.25 1.09 1.65 1.23 1.10 0.85 2.16 2.57 2.71 2.88 1.96 30.93 1.94 甜味 Ser 1.50 0.14 0.18 0.20 0.13 0.05 0.15 0.04 0.09 0.05 0.07 0.05 0.07 0.07 0.13 0.10 0.09 Gly 1.30 0.03 0.02 0.02 0.02 0.03 0.04 0.02 0.03 0.02 0.02 0.03 0.03 0.03 0.03 0.03 0.02 Thr 2.60 0.04 0.08 0.10 0.07 0.03 0.04 0.03 0.04 0.03 0.03 0.01 0.04 0.03 0.04 0.06 0.08 Ala 0.60 0.54 0.45 0.45 0.45 0.27 0.56 0.27 0.44 0.31 0.28 0.26 0.49 0.50 0.60 0.35 0.46 Lys 0.50 0.17 0.25 0.28 0.29 0.10 0.11 0.10 0.10 0.12 0.11 0.06 0.11 0.17 0.18 0.20 0.18 Pro 3.00 0.07 0.03 0.04 0.10 0.02 0.02 0.01 0.01 0.02 0.02 0.01 0.02 0.14 0.05 0.15 0.20 总和 0.99 1.01 1.09 1.06 0.50 0.92 0.47 0.71 0.55 0.53 0.42 0.76 0.94 1.03 0.89 1.03 12.92 0.82 苦味 His 0.20 0.27 0.39 1.18 0.36 0.20 0.47 0.16 0.19 0.38 0.13 0.05 0.25 0.49 0.49 0.71 0.44 Arg 0.50 0.31 0.69 1.51 1.05 0.12 0.31 0.12 0.20 0.17 0.15 0.08 0.15 0.37 0.42 0.46 0.36 Val 0.40 0.36 0.79 0.99 0.72 0.26 0.32 0.25 0.29 0.27 0.24 0.15 0.29 0.37 0.39 0.49 0.48 Met 0.30 0.07 0.10 0.09 0.11 0.05 0.06 0.05 0.06 0.05 0.05 0.03 0.07 0.06 0.09 0.08 0.07 Ile 0.90 0.09 0.20 0.24 0.17 0.06 0.09 0.06 0.07 0.07 0.06 0.02 0.10 0.11 0.12 0.18 0.13 Leu 1.90 0.04 0.09 0.13 0.09 0.02 0.02 0.03 0.03 0.03 0.02 0.01 0.02 0.04 0.04 0.05 0.05 Trp 0.90 0.01 0.05 0.05 0.04 0.02 0.02 0.01 0.01 0.02 0.01 0.01 0.01 0.01 0.01 0.02 0.03 总和 1.15 2.31 4.19 2.54 0.73 1.29 0.68 0.85 0.99 0.66 0.35 0.89 1.45 1.56 1.99 1.56 23.21 1.46 芳香族 Tyr 2.60 0.03 0.04 0.06 0.04 0.01 0.02 0.01 0.01 0.02 0.02 0.01 0.01 0.02 0.02 0.02 0.03 Cys 0.02 0.42 0.41 0.47 0.53 0.35 0.63 0.37 0.5 0.38 0.40 0.44 0.59 0.65 0.59 0.70 0.43 Phe 0.90 0.08 0.22 0.24 0.18 0.06 0.09 0.06 0.09 0.06 0.05 0.02 0.05 0.07 0.09 0.09 0.09 总和 0.53 0.67 0.77 0.75 0.42 0.74 0.44 0.6 0.46 0.47 0.47 0.65 0.74 0.70 0.81 0.55 9.71 0.61 注:*依据部分参考文献[9−12]。
下载: 导出CSV
表 3 主成分的特征值和贡献率
Table 3 Eigenvalues and contribution rates of principal components
主成分 特征值 贡献率(%) 累计贡献率(%) 1 13.800 59.999 59.999 2 3.730 16.219 76.218 3 1.260 5.478 81.696 4 1.225 5.326 87.022 5 0.838 3.642 90.664
下载: 导出CSV
表 4 主成分的特征向量和载荷值
Table 4 Eigenvectors and loading values of principal components
FAA PC1 PC2 PC3 PC4 特征
向量载荷 特征
向量载荷 特征
向量载荷 特征
向量载荷 Asp 0.243 0.903 −0.122 −0.236 0.205 0.230 0.033 0.037 Glu 0.111 0.412 0.040 0.078 −0.342 −0.384 0.573 0.634 Asn 0.253 0.941 0.153 0.296 0.013 0.015 0.083 0.092 Ser 0.226 0.840 0.058 0.113 −0.139 −0.157 −0.338 −0.374 Gln 0.167 0.620 0.390 0.754 0.035 0.039 −0.045 −0.049 His 0.208 0.771 0.139 0.268 −0.338 −0.380 0.197 0.219 Gly −0.062 −0.228 0.407 0.786 −0.010 −0.011 −0.179 −0.198 Thr 0.248 0.923 −0.054 −0.104 −0.041 −0.046 0.155 0.172 Cit 0.188 0.699 −0.183 −0.353 0.252 0.283 −0.126 −0.140 Arg 0.248 0.922 −0.043 −0.082 −0.151 −0.169 −0.085 −0.094 Ala 0.128 0.475 0.336 0.649 0.081 0.090 −0.201 −0.223 Tyr 0.257 0.956 −0.107 −0.206 −0.068 −0.077 −0.019 −0.021 Cys 0.063 0.236 0.449 0.867 0.156 0.175 −0.007 −0.008 Val 0.263 0.975 −0.080 −0.155 −0.111 −0.124 −0.020 −0.023 Met 0.246 0.915 0.087 0.168 0.155 0.174 −0.125 −0.138 Trp 0.241 0.896 −0.181 −0.350 −0.012 −0.014 −0.097 −0.107 Phe 0.251 0.931 −0.115 −0.223 −0.163 −0.183 −0.140 −0.155 Ile 0.263 0.975 0.030 0.057 −0.079 −0.089 0.074 0.082 Lys 0.260 0.967 −0.016 −0.030 0.129 0.144 −0.009 −0.010 Leu 0.256 0.952 −0.126 −0.242 −0.103 −0.116 −0.018 −0.020 Hyp 0.036 0.132 0.395 0.762 −0.171 −0.192 −0.026 −0.028 Pro 0.110 0.410 0.139 0.269 0.444 0.499 0.580 0.641 GABA 0.163 0.607 −0.060 −0.116 0.509 0.571 −0.029 −0.032
下载: 导出CSV
表 5 不同品种菜薹FAA主成分综合得分和排名
Table 5 Comprehensive scores and rankings of FAA main components of different cultivars of Brassica campestris
品种 F1 F2 F3 F4 F 排名 XT-1 −0.119 0.262 0.616 −0.701 −0.033 9 XT-2 1.492 −1.405 0.080 −0.868 0.625 4 XT-3 2.094 −0.419 −2.482 0.191 1.062 1 XT-4 1.438 −0.585 2.094 −1.075 0.825 2 HT-1 −0.912 −0.551 −1.122 0.647 −0.664 13 HT-3 −0.257 1.468 −0.432 −1.582 −0.024 8 HT-5 −0.968 −0.977 −0.823 0.416 −0.762 15 QY-1 −0.487 0.213 −0.086 0.314 −0.245 11 QY-2 −0.596 −1.051 0.334 0.324 −0.493 12 CT-2 −0.924 −0.654 0.100 −0.761 −0.695 14 CT-4 −1.470 −0.881 0.287 −0.541 −1.038 16 LH-1 −0.524 0.908 −0.266 −0.452 −0.206 10 LH-2 −0.038 1.301 0.336 1.160 0.269 7 ZT-2 0.247 1.576 −0.290 −0.551 0.359 6 ZM-2 0.560 1.221 0.607 1.243 0.634 3 HT-4 0.464 −0.425 1.046 2.235 0.386 5
下载: 导出CSV
-
[1] 吕思锐, 张德双, 李佩荣, 等. 菜薹花色遗传规律研究及花瓣主要营养成分分析[J]. 中国蔬菜,2022,26(4):13−20. [LÜ S R, ZHANG D S, LI P R, et al. Study on genetic regularity of flower color and analysis of main nutrients of flower petals of Chinese cabbage[J]. China Vegetables,2022,26(4):13−20.] LÜ S R, ZHANG D S, LI P R, et al. Study on genetic regularity of flower color and analysis of main nutrients of flower petals of Chinese cabbage[J]. China Vegetables, 2022, 26(4): 13−20.
[2] 黄颖, 吴婷, 曹伟伟, 等. 基于主成分和聚类分析的油菜薹营养与感官品质评价[J]. 食品与发酵工业,2020,46(17):253−258. [HUANG Y, WU T, CAO W W, et al. Evaluation of nutritional and sensory quality of cabbage fur based on principal component and cluster analysis[J]. Food and Fermentation Industry,2020,46(17):253−258.] HUANG Y, WU T, CAO W W, et al. Evaluation of nutritional and sensory quality of cabbage fur based on principal component and cluster analysis[J]. Food and Fermentation Industry, 2020, 46(17): 253−258.
[3] 吴艺飞, 丁茁荑, 周晓波, 等. 白菜薹新品种青芸1号的选育[J]. 中国瓜菜,2023,36(1):108−111. [WU Y F, DING Z Y, ZHOU X B, et al. Breeding of a new cabbage variety Qingyun No. 1[J]. China Cucurbits and Vegetables,2023,36(1):108−111.] WU Y F, DING Z Y, ZHOU X B, et al. Breeding of a new cabbage variety Qingyun No. 1[J]. China Cucurbits and Vegetables, 2023, 36(1): 108−111.
[4] 刘伟, 张群, 李志坚, 等. 不同品种黄花菜游离氨基酸组成的主成分分析及聚类分析[J]. 食品科学,2019,40(10):243−250. [LIU W, ZHANG Q, LI Z J, et al. Principal component analysis and cluster analysis of free amino acid composition of different varieties of daylily[J]. Food Science,2019,40(10):243−250.] LIU W, ZHANG Q, LI Z J, et al. Principal component analysis and cluster analysis of free amino acid composition of different varieties of daylily[J]. Food Science, 2019, 40(10): 243−250.
[5] ZHANG S, LI C, WU J, et al. Properties investigations of rape stalks fermented by different salt concentration:Effect of volatile compounds and physicochemical indexes[J]. Food Chemistry:X,2023,18:100746.
[6] SUN T, XU H, ZHANG H, et al. Maillard reaction of oat β−glucan and the rheological property of its amino acid/peptide conjugates[J]. Food Hydrocolloids,2018,76:30−34. doi: 10.1016/j.foodhyd.2017.07.025
[7] SALMAN S, YILMAZ C, GÖKMEN V, et al. Effects of fermentation time and shooting period on amino acid derivatives and free amino acid profiles of tea[J]. LWT-Food Science and Technology,2021,137:110481. doi: 10.1016/j.lwt.2020.110481
[8] ZHAO C J, SCHIEBER A, GÄNZLE M G, et al. Formation of taste−active amino acids amino acid derivatives and peptides in food fermentations-A review[J]. Food Research International,2016,89:39−47. doi: 10.1016/j.foodres.2016.08.042
[9] 葛帅, 王蓉蓉, 王颖瑞, 等. 湖南常见辣椒品种游离氨基酸主成分分析及综合评价[J]. 食品科学技术学报,2021,39(2):91−102. [GE S, WANG R R, WANG Y R, et al. Principal component analysis and comprehensive evaluation of free amino acids in common pepper varieties in Hunan[J]. Journal of Food Science and Technology,2021,39(2):91−102.] doi: 10.12301/j.issn.2095-6002.2021.02.012 GE S, WANG R R, WANG Y R, et al. Principal component analysis and comprehensive evaluation of free amino acids in common pepper varieties in Hunan[J]. Journal of Food Science and Technology, 2021, 39(2): 91−102. doi: 10.12301/j.issn.2095-6002.2021.02.012
[10] 蒋四强, 李雄波, 邓维琴, 等. 不同品种蚕豆发酵甜瓣子非挥发性风味物质对比分析[J]. 现代食品科技,2023,39(8):264−272. [JIANG S Q, LI X B, DENG W Q, et al. Comparative analysis of non−volatile flavor substances in fermented sweet seed of broad bean[J]. Modern Food Science and Technology,2023,39(8):264−272.] JIANG S Q, LI X B, DENG W Q, et al. Comparative analysis of non−volatile flavor substances in fermented sweet seed of broad bean[J]. Modern Food Science and Technology, 2023, 39(8): 264−272.
[11] ARES A M, TORIBIO, L, TAPIA J A, et al. Differentiation of bee pollen samples according to the apiary of origin and harvesting period based on their amino acid content[J]. Food Bioscience,2022,50:102092. doi: 10.1016/j.fbio.2022.102092
[12] 王馨雨, 王蓉蓉, 王婷, 等. 不同品种百合内外鳞片游离氨基酸组成的主成分分析及聚类分析[J]. 食品科学,2020,41(12):211−220. [WANG X Y, WANG R R, WANG T, et al. Principal component analysis and cluster analysis of free amino acid compositions in the inner and outer scales of lilies of different varieties[J]. Food Science,2020,41(12):211−220.] doi: 10.7506/spkx1002-6630-20190709-117 WANG X Y, WANG R R, WANG T, et al. Principal component analysis and cluster analysis of free amino acid compositions in the inner and outer scales of lilies of different varieties[J]. Food Science, 2020, 41(12): 211−220. doi: 10.7506/spkx1002-6630-20190709-117
[13] LÜ W, LIN T, REN Z, et al. Rapid discrimination of Citrus reticulata 'Chachi' by headspace-gas chromatography-ion mobility spectrometry fingerprints combined with principal component analysis[J]. Food Research International,2020,131:108985. doi: 10.1016/j.foodres.2020.108985
[14] RODRÍGUEZ-MARTÍN N M, MÁRQUEZ-LÓPEZ J C, CERRILLO I, et al. Production of chickpea protein hydrolysate at laboratory and pilot plant scales:Optimization using principal component analysis based on antioxidant activities[J]. Food Chemistry,2024,437:137707. doi: 10.1016/j.foodchem.2023.137707
[15] 刘芹, 特日根, 师子文, 等. 不同品种香菇子实体游离氨基酸组成的主成分分析及综合评价[J]. 河南农业科学, 2022, 51(7):134−144. [LIU Q, TE R G, SHI Z W, et al. Principal component analysis and comprehensive evaluation of the free amino acid composition of Lentinus edodes fruiting bodies of different varieties[J]. Henan Agricultural Sciences 2022, 51(7):134−144.] LIU Q, TE R G, SHI Z W, et al. Principal component analysis and comprehensive evaluation of the free amino acid composition of Lentinus edodes fruiting bodies of different varieties[J]. Henan Agricultural Sciences 2022, 51(7): 134−144.
[16] 李丛聪. 不同食盐浓度腌制油菜苔风味特征及理化品质研究[D]. 长沙:湖南农业大学, 2021. [LI C C. Study on flavor characteristics and physicochemical quality of pickled pickled cabbage with different salt concentrations[D]. Changsha:Hunan Agricultural University, 2021.] LI C C. Study on flavor characteristics and physicochemical quality of pickled pickled cabbage with different salt concentrations[D]. Changsha: Hunan Agricultural University, 2021.
[17] 宋廷宇, 侯喜林, 何启伟, 等. 不同薹菜品种氨基酸含量分析[J]. 中国蔬菜, 2007, 9(11):8−10. [SONG T Y, HOU X L, HE Q W, et al. Analysis of amino acid content of different cabbage varieties[J]. China Vegetables 2007, 9(11):8−10.] SONG T Y, HOU X L, HE Q W, et al. Analysis of amino acid content of different cabbage varieties[J]. China Vegetables 2007, 9(11): 8−10.
[18] 王申, 周炳妤, 张培竹, 等. 不同施钾技术对甘蓝型油菜菜薹产量和品质的影响[J]. 中国瓜菜,2024,37(1):103−109. [WANG S, ZHOU B Y, ZHANG P Z, et al. Effects of different potassium fertilization techniques on the yield and quality of Brassica napus[J]. China Cucurbits and Vegetables,2024,37(1):103−109.] WANG S, ZHOU B Y, ZHANG P Z, et al. Effects of different potassium fertilization techniques on the yield and quality of Brassica napus[J]. China Cucurbits and Vegetables, 2024, 37(1): 103−109.
[19] CRUZAT V, MACEDO ROGERO M, NOEL KEANE K, et al. Glutamine:Metabolism and immune function supplementation and clinical translation[J]. Nutrients,2018,10(11):1564. doi: 10.3390/nu10111564
[20] GAMBARDELLA J, KHONDKAR W, MORELLI M B, et al. Arginine and endothelial function[J]. Biomedicines,2020,8(8):277. doi: 10.3390/biomedicines8080277
[21] CAO C, SUN H, SONG X, et al. Effect of fermentation with Tetragenococcus halophilus and Zygosaccharomyces rouxii on selected non−volatile taste compounds in soybean protein hydrolysates[J]. LWT-Food Science and Technology,2023,184:115053. doi: 10.1016/j.lwt.2023.115053
[22] MOERDIJK−POORTVLIET T C, de JONG D L, FREMOUW R, et al. Extraction and analysis of free amino acids and 5′-nucleotides the key contributors to the umami taste of seaweed[J]. Food Chemistry,2022,370:131352. doi: 10.1016/j.foodchem.2021.131352
[23] YANG J, HUANG Y, CUI C, et al. Umami−enhancing effect of typical kokumi-active γ-glutamyl peptides evaluated via sensory analysis and molecular modeling approaches[J]. Food Chemistry,2021,338:128018. doi: 10.1016/j.foodchem.2020.128018
[24] HAN S W, SHIN J S. Aromatic L-amino acid decarboxylases:mechanistic features and microbial applications[J]. Applied Microbiology and Biotechnology,2022,106(12):4445−4458. doi: 10.1007/s00253-022-12028-4
[25] 原远, 周贤玉, 李光光, 等. 综合评价比较菜心及其近缘亚种蔬菜氨基酸营养价值[J]. 食品与发酵工业,2019,45(14):102−107. [YUAN Y, ZHOU X Y, LI G G, et al. Comprehensive evaluation and comparison of amino acid nutritional value of caexin and its related subspecies[J]. Food and Fermentation Industry,2019,45(14):102−107.] YUAN Y, ZHOU X Y, LI G G, et al. Comprehensive evaluation and comparison of amino acid nutritional value of caexin and its related subspecies[J]. Food and Fermentation Industry, 2019, 45(14): 102−107.
[26] LIU P, WU P, BI J, et al. Development of an analytic method for organosulfur compounds in Welsh onion and its use for nutritional quality analysis of five typical varieties in China[J]. Food Chemistry,2024,441:138237. doi: 10.1016/j.foodchem.2023.138237
[27] 董琼, 李世民, 高尚杰, 等. 不同种源树番茄果实品质比较及综合分析[J]. 食品与发酵工业,2022,48(4):266−273. [DONG Q, LI S M, GAO S J, et al. Different provenance tree tomato fruit quality comparison and comprehensive analysis[J]. Journal of Food and Fermentation Industry,2022,48(4):266−273.] DONG Q, LI S M, GAO S J, et al. Different provenance tree tomato fruit quality comparison and comprehensive analysis[J]. Journal of Food and Fermentation Industry, 2022, 48(4): 266−273.
[28] 张晓绘, 李汴生, 阮征, 等. 基于主成分分析法综合评价即食米饭品质特性[J]. 中国调味品,2024,49(1):1−7. [ZHANG X H, LI B S, RUAN Z, et al. Comprehensive evaluation of the quality characteristics of ready-to-eat rice based on principal component analysis[J]. Chinese Condiment,2024,49(1):1−7.] doi: 10.3969/j.issn.1000-9973.2024.01.001 ZHANG X H, LI B S, RUAN Z, et al. Comprehensive evaluation of the quality characteristics of ready-to-eat rice based on principal component analysis[J]. Chinese Condiment, 2024, 49(1): 1−7. doi: 10.3969/j.issn.1000-9973.2024.01.001
[29] ZHANG S J, LI C C, WU J L, et al. Effect of salt concentration on flavor characteristics and physicochemical quality of pickled Brassica napus[J]. Fermentation,2023,9(3):275. doi: 10.3390/fermentation9030275
[30] NASCIMENTO L E S, ARRIOLA N D A, DA SILVA L A L, et al. Phytochemical profile of different anatomical parts of jambu (Acmella oleracea (L.) R. K. Jansen):A comparison between hydroponic and conventional cultivation using PCA and cluster analysis[J]. Food Chemistry,2020,332(1):127393.
 下载:
下载:


计量
- 文章访问数: 47
- HTML全文浏览量: 8
- PDF下载量: 13