


Uncertainty Evaluation of Triazophos Residues in Green Tea Based on GUM Method and Control Chart Method
-
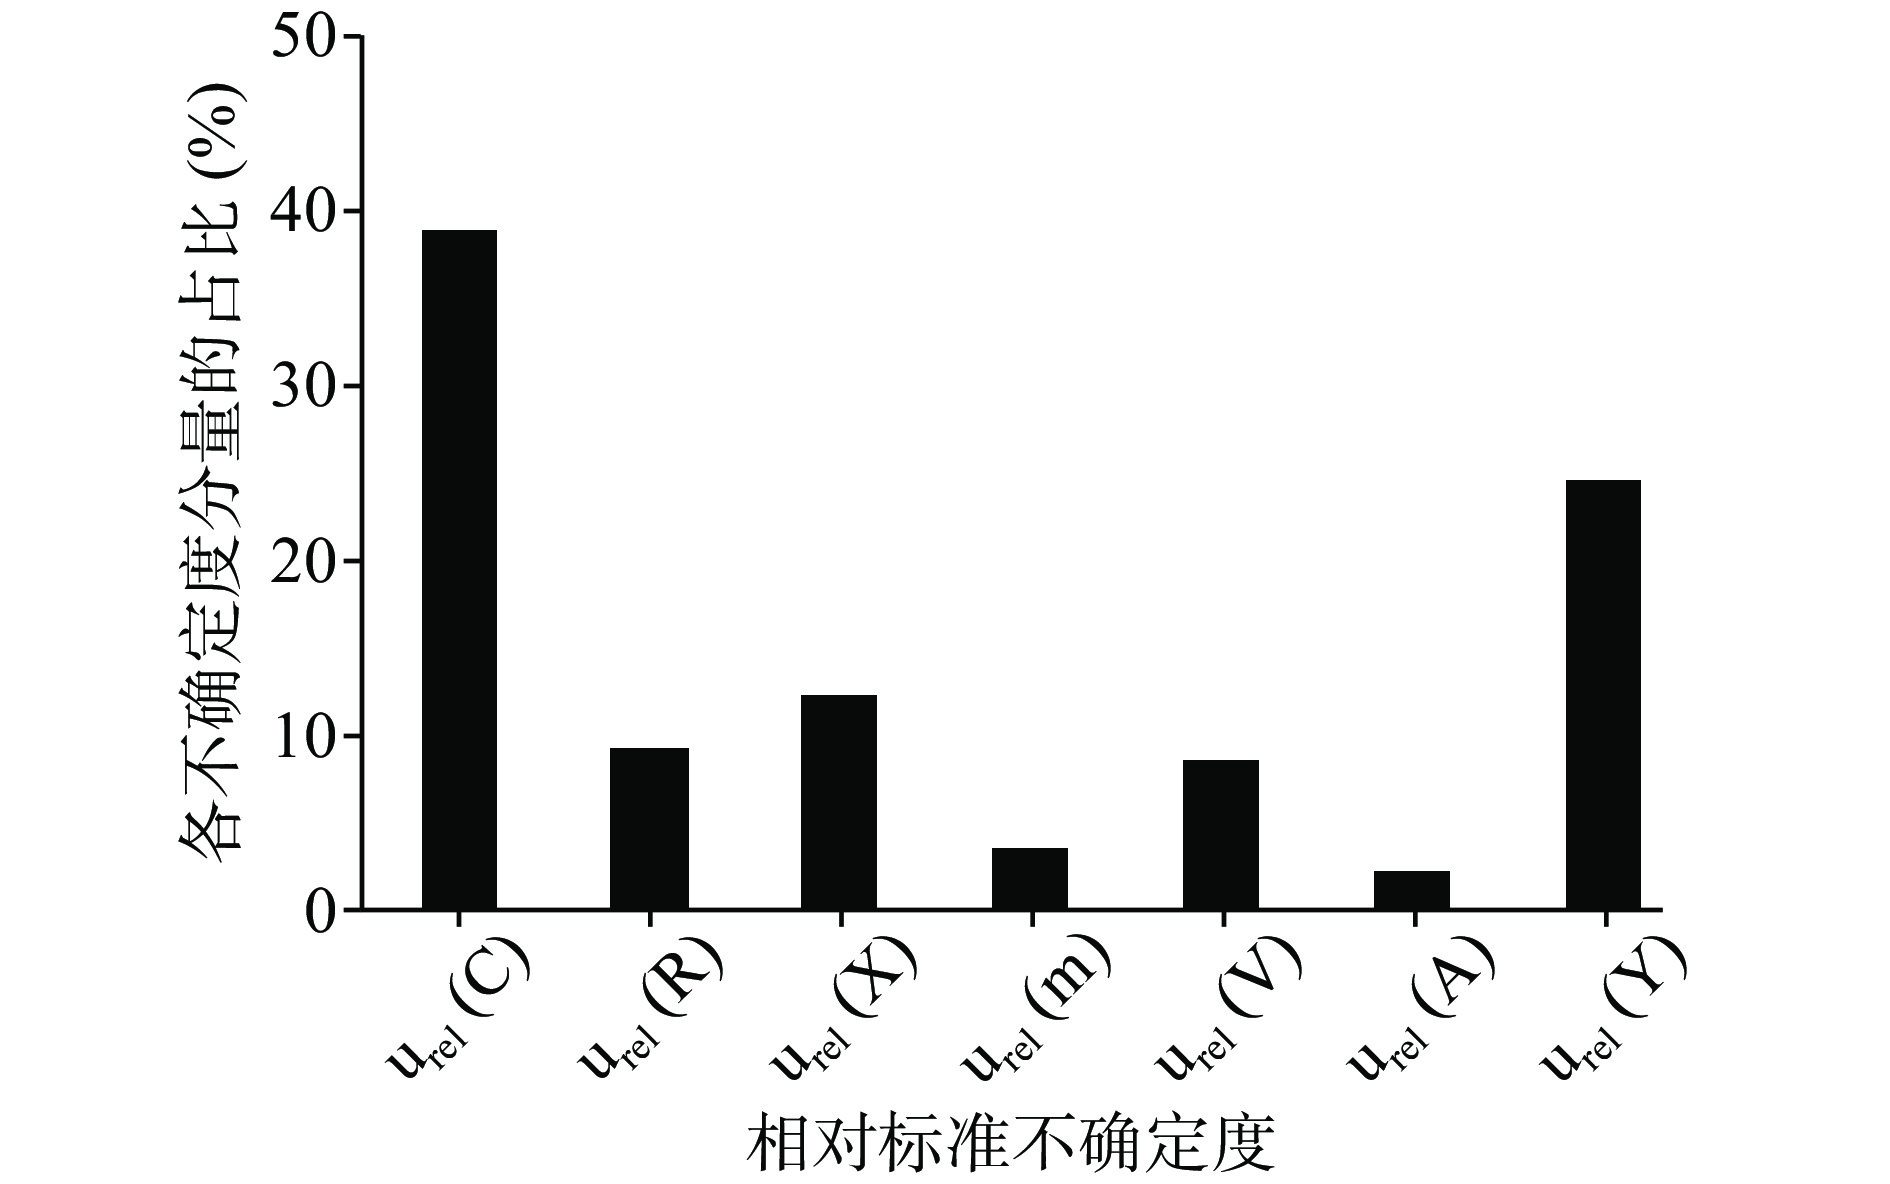
摘要: 采用气相色谱-串联质谱法(GC-MS/MS)测定绿茶中三唑磷的残留量并进行不确定度评定。依据ISO/IEC Guide 98-3:2008(GUM法)和GB/T 27411-2012《检测实验室中常用不确定度评定方法与表示》(控制图法)对检测结果进行不确定度的分析与量化。结果表明,GUM法和控制图法的评定结果分别为(0.112±0.012)mg/kg,k=2和(0.108±0.018)mg/kg,k=2。GUM法的不确定度主要来源是质量浓度和仪器稳定性,其各自占总不确定度的38.9%和24.7%。控制图法只对检测结果进行统计分析,简单易操作,考察的是检测结果的长期趋势,可在日常检测工作中的内部质量控制应用中得到实施,而GUM法适用于复检样品或客户对不确定度有要求时的评定,计算复杂,但可在短时间内获得不确定度评定结果。Abstract: The amount of residual triazophos in green tea was determined by gas chromatography tandem mass spectrometry (GC-MS/MS) and then the uncertainty was evaluated. According to ISO/IEC Guide 98-3: 2008 (GUM method) and GB/T 27411-2012 "Common uncertainty assessment methods and representations in testing laboratories" (control chart method), the uncertainty of the measurement results was analyzed and quantified. Results showed that, the evaluation results of the GUM method and the control chart method were (0.112±0.012) mg/kg, k=2 and (0.108±0.018) mg/kg, k=2, respectively. The main sources of uncertainty of the GUM method were mass concentration and instrument stability, which accounted for 38.9% and 24.7% of the total uncertainty respectively. The control chart method only performed statistical analysis of the test results, which was simple and easy to operate. It inspected the long-term trend of the test results and could be implemented in the application of internal quality control in daily testing work. The GUM method was suitable for re-examination of samples or the evaluation of uncertainty requirements by customers. The calculation was complex, but the uncertainty evaluation results could be obtained in the short term.
-
Keywords:
- uncertainty /
- triazophos /
- green tea /
- GUM method /
- control chart method
-
三唑磷是广谱性的有机磷杀虫杀螨剂,还兼有一定的杀线虫作用[1-2]。截至2022年3月25日,从中国农药信息网上可以查到有效成分含三唑磷的农药登记产品有387个,其中用于水稻防治螟虫、稻水象甲和稻瘿蚊的有338种;用于棉花防治棉铃虫和红铃虫的有30种[3]。在国内,农业部2032号公告决定自2016年12月31日起,禁止在蔬菜上使用[4]。而目前GB 2763-2021却没有规定三唑磷在茶叶上的使用限量,导致地方政府抽检的行政处罚缺少法律依据[5];在国外,三唑磷被世界卫生组织定义为高毒农药,日本、美国和欧盟在茶叶上的残留限量均为0.01 mg/kg,而印度自2020年12月31日起禁用三唑磷[6-8]。出口的茶叶的三唑磷残留限量低,而国内部分茶农在茶叶的生产种植过程中会使用三唑磷防治红蜘蛛等[9],导致茶叶中的三唑磷时有检出,有研究表明茶叶中三唑磷在冲泡过程中的浸出率为30%左右[10],对饮茶爱好者构成潜在的健康威胁。
目前,《国家食品安全监督抽检实施细则(2022年版)》规定了豇豆、柑、橘、橙需要抽检三唑磷项目,采用GB 2763进行判定,检测方法为GB 23200.113、GB 23200.116、GB 23200.121或NY/T 761。《检验检测机构资质认定能力评价 食品复检机构要求》里面规定了食品复检项目除了给出检测结果外,还需提供相应的扩展不确定度[11]。测量不确定度是用于评价不同人检测结果质量的一个重要参数,是用来表征检测结果的分散程序,其数值的大小反映了检测结果质量的高低,在特定条件下还与检测结果的符合性判定相关[12-14]。目前主流实验室测定茶叶中的三唑磷残留量主要采用的测定方法是GB 23200.113(GC-MS/MS)和GB 23200.13(LC-MS/MS),而早期一些文献报导的农产品(蔬菜、谷物和茶叶)中三唑磷不确定度评定涉及的主要检测设备是气相色谱仪(配备火焰光度检测器,GC-FPD)和气相色谱仪串联质谱仪(配EI源,GC-MS),而采用LC-MS/MS检测方法评定三唑磷的不确定度的基质是中药材元胡,其不确定度的来源主要有添加回收率、标准曲线拟合、数据修约、体积量取定容、仪器稳定性、标准溶液配制[15-21],未见有人对采用GC-MS/MS法测定茶叶中的三唑磷残留量的不确定度进行评定,且已有的文献均是采用GUM法评定,未见有采用控制图法进行评定。
本文采用GC-MS/MS法对绿茶中的三唑磷残留量进行检测,并用GUM法和控制图法分别对茶叶中的三唑磷的检测结果进行不确定度评定,通过比较和分析GUM法和控制图法的优劣,为实验室内部质量控制提供科学依据,为其他检验检测机构提供不确定度评定思路。
1. 材料与方法
1.1 材料与仪器
绿茶 购自当地超市;三唑磷 CAS:24017-47-8,德国Dr.E公司,纯度99.99%,扩展不确定度0.3%;乙腈、乙酸乙酯、乙酸 均为色谱纯,德国Merck公司;氯化钠、硫酸镁 均为分析纯,西陇科学股份有限公司 ;C18粉末、N-丙基乙二胺(PSA)粉末、石墨化炭黑(GCB)粉末 天津博纳艾杰尔科技有限公司。
TSQ 8000 EVO三重四极杆气质联用仪 配EI源,赛默飞世尔科技(中国)有限公司;LA130S-F电子天平 德国Sartorius公司;MS3 Basic涡旋振荡器 德国IKA公司;HGC-12A氮吹仪 上海禾工科学仪器有限公司;HP-5MS毛细管柱(规格:30 m×0.25 mm,0.25 μm) 美国Agilent公司;SIGMA2-16K台式离心机 德国Sartorius公司。
1.2 实验方法
1.2.1 样品前处理
自制质控样品:取1 kg绿茶于粉碎机粉碎后,过425 μm的标准筛网过筛,混匀,从中称取400 g样品并加入100 μg/mL的三唑磷标液0.50 mL,混匀并放入粉碎机重新粉碎一次后用自封袋封装后置于−18 ℃中冷冻保存备用。剩余未添加三唑磷的样品可用于制作标准曲线的空白基质和回收率的考察,用自封袋封装后置于−18 ℃中冷冻保存备用。
准确称取2 g(精确至0.01 g)绿茶粉末至50 mL塑料离心管中,加入10 mL去离子水,涡旋混匀静置30 min,加入含有1%醋酸乙腈15 mL、6 g无水硫酸镁、1.5 g氯化钠和一颗陶瓷均质子,盖上盖子,剧烈振荡提取3 min。于10000 r/min离心5 min,准确移取上清液6 mL于15 mL净化管中,管内含有1200 mg无水硫酸钠、400 mg N-丙基乙二胺硅烷(PSA)粉末,400 mg 石墨化炭黑(GCB)粉末、200 mg C18粉末涡旋净化3 min,于10000 r/min离心5 min,准确移取上清液3.00 mL于10 mL塑料离心管中氮吹至干,准确移取1.00 mL乙酸乙酯复溶上机测定。
1.2.2 仪器条件
依据标准方法GB 23200.113-2018的色谱和质谱条件,并进行微调。色谱柱:HP-5MS毛细管柱;进样口:260 ℃;分流模式:不分流进样;进样量:1 μL;柱流量:1.0 mL/min;升温程序:60 ℃保持2 min,30 ℃/min升至150 ℃,5 ℃/min升至250 ℃,10 ℃/min升至300 ℃保持6 min。传输线温度:280 ℃;离子源温度:230 ℃;四极杆温度:150 ℃;溶剂延迟5 min,其他参数与仪器自带调谐参数一致。三唑磷的定性离子对:257.0>162.0(CE:10 V,驻留时间20 ms)、257.0>134.0(CE:20 V,驻留时间20 ms);定量离子对:257.0>162.0(CE:10 V,驻留时间20 ms)。
1.2.3 结果计算
茶叶中的三唑磷残留量的检测结果采用空白样品标准加入法制作标准曲线,外标法定量,其计算公式如下:
X=C×Vm×V1V2×1R×10001000 式中:X,被测物残留量,mg/kg;C,被测物的质量浓度,μg/mL;V,提取液定容体积,mL;m,试样质量,g;V1,试样提取溶剂体积,mL;V2,试样分取体积,mL;R,回收率,%;1000,单位换算系数。
1.3 数据处理
1.3.1 GUM法
通常情况下GUM法的评定流程:一是分析不确定度来源并建立测定模型;二是评定各分量标准不确定度;三是计算合成标准不确定度;四是确定扩展不确定度;五是报告测量结果。采用鱼骨图分析法对绿茶中三唑磷残留量的测定过程中的不确定度来源进行分析,其测量模型的建立与1.2.3结果计算的公式一致,并对各不确定度分量进行不确定度评定。
1.3.2 控制图法
在日常检测过程中称取2个平行质控样品(绿茶)与常规样品一同检测,并依据1.2.3结果计算数据处理,记录和获得一系列不同人员在不同时间下对绿茶中三唑磷残留量进行测定的检测结果,再运用统计学方法对检测结果进行异常值检验、正态性和独立性检验,并作图分析。
2. 结果与分析
2.1 GUM法评定绿茶中三唑磷残留量的不确定度
2.1.1 不确定度来源分析
对绿茶中三唑磷残留量检测结果的不确定度来源分析见图1。其中回收率、校准曲线拟合和测量重复性属于A类不确定度评定,其他属于B类不确定度评定。
![]() 图 1 气相色谱串联质谱法测定茶叶中三唑磷残留量的不确定度来源Figure 1. Uncertainty source for determination of triazophos in tea by GC-MS/MS
图 1 气相色谱串联质谱法测定茶叶中三唑磷残留量的不确定度来源Figure 1. Uncertainty source for determination of triazophos in tea by GC-MS/MS2.1.2 各标准不确定度分量的评定
由1.2.3的检测结果计算公式和图1可知,不确定度分量有质量浓度C、回收率R、测量重复性
ˉX 、样品质量m、体积量取V、数字修约A和仪器稳定性Y,其中环境条件的稳定性已经在测量重复性里面体现了,不再考虑。因各不确定度分量是乘除关系,故可用简易方法进行相对标准不确定度的合成:urel(X)=√urel(C)2+urel(R)2+urel(¯X)2+urel(m)2+urel(V)2+urel(A)2+urel(Y)2 式中:urel(C),质量浓度的相对标准不确定度分量;urel(R),回收率的相对标准不确定度分量;urel(
¯X ),测量重复性的相对标准不确定度分量;urel(m),样品质量的相对标准不确定度分量;urel(A),数字修约的相对标准不确定度分量;urel(Y),仪器稳定性的相对标准不确定度分量;urel(V),分取或定容体积量取的相对标准不确定度分量。2.1.2.1 被测物的质量浓度C引入的不确定度
质量浓度C的不确定度由标准物质的不确定度、标准溶液配制的不确定度和标准曲线线性拟合的不确定度三个部分组成。标准溶液配制又包括储备液配制、储备液稀释及工作曲线配制三个过程。
a.储备液配制过程引入的不确定度u(C1) 操作:用十万分之一天平准确称取25.01 mg的标准物质三唑磷于50 mL容量瓶中,用乙酸乙酯溶解定容,得到质量浓度为500 mg/L。三唑磷纯度引入的相对标准不确定度urel(p):标准物质证书上给出三唑磷的扩展不确定度U(p)=0.3%,扩展因子k=2,纯度p为99.99%。则代入公式urel(p)=U(p)/(k×p)=0.3%/(2×99.99%)=0.00150。天平称量三唑磷质量时引入的相对标准不确定度urel(ms):天平的检定证书给出的最大允差为±0.01 mg,按均匀分布计算,标准不确定度u(ms)=0.01/
√3 =0.00577 mg。称量时包括归零和称量两个操作,相对标准不确定度urel(ms)=u(ms)/ms×√2 =0.00577/25.01×√2 =0.000327。容量瓶定容时引入的相对标准不确定度urel(V1):JJG 196-2006《常用玻璃量器》规定20 ℃时50 mL A级容量瓶的容量充差是0.05 mL,假设为三角分布,其标准不确定度为u(Vs)=0.05/√6 =0.0204 mL。实验室正常的温度波动是(20±5)℃,乙酸乙酯的体积膨胀系数为0.00138 ℃−1,假设温度的波动为均匀分布,则容量瓶由温度引入的体积不确定度为u(Vt)=(5×0.00138×50)/√3 =0.199 mL。容量瓶引入的相对标准不确定度为urel(V1)=√0.02042+0.1992/50=0.00400 。储备液配制过程中所产生的合成相对标准不确定度urel(C1):urel(C1)=√urel(p)2+urel(ms)2+urel(V1)2=0.00428 。b.储备液稀释过程引入的不确定度u(C2) 操作:用1 mL移液管移取1.00 mL储备液至50 mL容量瓶,用乙酸乙酯定容至刻度,摇匀,得中间液A为10 mg/L,再用另一支移液管移取1.00 mL工作液A至10 mL容量瓶,乙酸乙酯定容至刻度,摇匀,得工作液B为1.0 mg/L。移液管按均匀分布,容量瓶按三角分布,则移液管和容量瓶引入的不确定度计算见表1。
表 1 储备液稀释过程引入的不确定度Table 1. Uncertainty resulting from stock solution dilution项目 移液管
1 mL容量瓶
100 mL容量瓶
10 mL移取体积(mL) 1.00 1.00 1.00 容量允差(mL) 0.008 0.1 0.02 计算公式 0.008/√3 0.1/√6 0.02/√6 相对标准不确定度u(V)/mL 0.00462 0.0408 0.00816 温度误差(℃) ±5 乙酸乙酯膨胀系数(℃−1) 0.00138 计算公式 0.00138×V×5/√3 标准不确定度u(Vt)/mL 0.00690 0.690 0.0690 合成相对标准不确定度urel(V) 0.00830 0.00691 0.00695 则储备液稀释过程产生的相对标准不确定度urel(C2):
urel(C2)=√2×urel(V1mL移液管)2+urel(V10mL容量瓶)2+urel(V50mL容量瓶)2=0.0103, 式中:urel(V1 mL移液管),1 mL移液管的相对标准不确定度;urel(V10 mL容量瓶),10 mL容量瓶的相对标准不确定度;urel(V50 mL容量瓶),50 mL容量瓶的相对标准不确定度。
c.标准工作曲线配制过程引入的不确定度u(C3) 操作:分别称取2 g(精确至0.01 g)空白绿茶粉末于编号为1~6的50 mL离心管内,向1~3号管内添加40、100、200 µL质量浓度为1.00 mg/L的工作液B,向4~6号管内添加40、100、200 µL质量浓度为10.0 mg/L的工作液A,按照1.2.1的样品前处理,得到含量为0.02、0.05、0.10、0.20、0.50、1.00 mg/kg的空白基质添加的标准工作曲线(标准加入法)。移液器刻度误差参照JJG 646-2006《移液器检定规程》的要求,按均匀分布处理,则移液器和环境温度波动引入的不确定度计算见表2。
表 2 标准工作曲线制作过程引入的不确定度Table 2. Uncertainty introduced by the production process of standard working curve项目 移液器
50 µL移液器
100 µL移液器
200 µL移液器
50 µL移液器
100 µL移液器
200 µL移液体积(mL) 0.040 0.100 0.200 0.040 0.100 0.200 容量允差(mL) ±0.0012 ±0.002 ±0.003 ±0.0012 ±0.002 ±0.003 计算公式 0.0012/√3 0.002/√3 0.003/√3 0.0012/√3 0.002/√3 0.003/√3 不确定度u(Vv)/mL 0.00069 0.00115 0.00173 0.00069 0.00115 0.00173 测量重复性(mL) ±0.00075 ±0.001 ±0.002 ±0.00075 ±0.001 ±0.002 计算公式 0.00075/√3 0.001/√3 0.002/√3 0.00075/√3 0.001/√3 0.002/√3 不确定度u(Vr)/mL 0.000430 0.000580 0.00115 0.000431 0.000582 0.00115 温度误差(℃) ±5 乙酸乙酯膨胀系数(℃−1) 0.00138 计算公式 0.00138×V×5/√3 不确定度u(Vt)/mL 0.000159 0.000398 0.000797 0.000159 0.000398 0.000797 相对合成不确定度urel(V) 0.0208 0.0135 0.0111 0.0208 0.0135 0.0111 则由空白基质添加标准曲线测定过程中产生的相对标准不确定度urel(C3):
urel(c3)=√urel(V50µL)2+2×urel(V100µL)2+2×urel(V200µL)2+urel(V1000µL)2=0.0385 式中:urel(V50 μL),移液器移取50 μL标准工作液引入的相对标准不确定度;urel(V100 μL),移液器移取100 μL标准工作液引入的相对标准不确定度;urel(V200 μL),移液器移取200 μL标准工作液引入的相对标准不确定度;urel(V1000 μL),移液器移取1000 μL标准工作液引入的相对标准不确定度。
d.标准曲线拟合产生的不确定度u(C4) 校准曲线上对应的6个浓度点为:0.008、0.020、0.040、0.080、0.200、0.400 mg/L,每个浓度点重复测定三次,得到相应的峰面积A,通过Excel 2010进行线性拟合(包含原点),拟合方程为A=k×C+b(A为峰面积、k为斜率、C为质量浓度、b为截距),各浓度点对应的峰面积检测结果见表3。线性拟合产生的不确定度计算公式如下:
表 3 标准添加工作曲线线性拟合结果Table 3. Linear fitting results of standard added working curve标准溶液C(mg/L) 峰面积-1 峰面积-2 峰面积-3 回归方程 决定系数R2 0.008 51995 52004 51848 A=6510276×C−635 0.999 0.020 129998 130009 130139 0.040 259937 260197 259937 0.080 519874 519354 524548 0.200 1299961 1297361 1294766 0.400 2600047 2594847 2620795 urel(C4)=sa×Cy√1p+1n+(Cy−¯C)2∑ni=1(Ci−¯C)2 s=√∑ni=1[Ai−(kCi+b)]2n−2 式中,s,各浓度点对应的峰面积残差和,s=5423;n为测定次数,6个浓度点各自重复测定3次,n=18;p为对质控样品测定次数,平行测定3次,p=3;Cy为质控样品测定的质量浓度(见表4),Cy=0.0462 mg/L;
¯C 为各浓度点的平均质量浓度,¯C =0.125 mg/L;∑6i=1(Ci−¯C)2 =0.121 (mg/L)2;代入式中,线性拟合的相对标准不确定度urel(C4)=0.0163。表 4 阳性样品平行检测结果Table 4. Parallel determination results of positive samples待测农药 峰面积 质量浓度(mg/L) 平均质量浓度(mg/L) 三唑磷 300125 0.0462 0.0462 301197 0.0464 299998 0.0462 综上,三唑磷质量浓度C引入的相对标准不确定度为:
urel(C)=√urel(C1)2+urel(C2)2+urel(C3)2+urel(C4)2=0.0433 2.1.2.2 测量回收率产生的不确定度u (R)
操作:称取空白绿茶2 g(精确至0.01 g)并加入1.00 μg/mL标准工作液0.200 mL,相当于理论加标水平:0.1 mg/kg,平行测定10次,将重复测定的平均回收率
¯R 和标准偏差s(¯R) 代入urel(R)=s(¯R)√nׯR=s(¯R)√10ׯR=0.0105 (其中n为平行测定次数),计算得到的回收率引入的标准不确定度和相对标准不确定度见表5。表 5 绿茶中三唑磷加标回收的不确定度评定结果Table 5. Uncertainty evaluation results of triazophos recovery in green tea重复次数 称样量(g) 质量浓度
(mg/L)加标含量
(mg/kg)回收率(%) 1 2.00 0.0411 0.103 102.8 2 1.98 0.0375 0.095 94.7 3 1.99 0.0399 0.100 100.3 4 2.03 0.0412 0.101 101.5 5 2.04 0.0385 0.094 94.4 6 1.99 0.0409 0.103 102.8 7 2.01 0.0394 0.098 98.0 8 2.02 0.0401 0.099 99.3 9 2.00 0.0397 0.099 99.3 10 2.03 0.0423 0.104 104.2 平均值 2.01 0.0401 0.100 99.7 标准偏差 0.0202 0.001402 0.00332 0.0332 标准不确定度 0.00640 0.00044 0.00105 0.0105 相对标准不确定度 0.00319 0.0111 0.0105 0.0105 注:加标水平0.1 mg/kg,重复数n=10。 采用t检验法验证结果是否需要校正回收:
t计算=|R−¯R|s/√n=|1.000−0.997|0.0332/√10=0.286 ,查t值的双边分布表,自由度为9时,95%的置信度条件下,临界值为2.262,t计算小于临界值,检测结果不需要校正回收。2.1.2.3 测量重复性产生的不确定度u(
¯X )对质控样品绿茶中的三唑磷残留量重复测定10次,检测结果
¯X 和标准偏差s(¯X) 代入urel(X)=s(¯X)√nׯX=s(¯X)√10ׯX=0.0138 (其中n为重复测定次数),重复测定结果的相对标准不确定度评定结果见表6。由urel(X)的计算公式可知重复测定次数越多,相对标准不确定度越小,但是在实际检测过程中大都采用平行测定,其不确定度评定值会更大一些。表 6 绿茶中三唑磷重复测定的不确定度评定结果Table 6. Uncertainty evaluation results of repeated determination of triazophos in green tean 称样量(g) 质量浓度(mg/L) 含量(mg/kg) 1 2.00 0.0473 0.118 2 1.98 0.0442 0.112 3 1.99 0.0463 0.116 4 2.03 0.0446 0.110 5 2.04 0.0431 0.106 6 1.99 0.0432 0.109 7 2.01 0.0432 0.107 8 2.02 0.0472 0.117 9 2.00 0.0469 0.117 10 2.03 0.0433 0.107 平均值 2.01 0.0449 0.112 标准偏差 0.0202 0.00180 0.00489 不确定度 0.00640 0.00057 0.00155 相对标准不确定度 0.00319 0.0127 0.0138 注:重复次数n=10。 2.1.2.4 试样称量引入的不确定度u(m)
操作:使用百分位天平称取2 g样品,天平的校准证书显示其最大允差为±0.01 g,按均匀分布计算,其标准不确定度为u(m)=
0.01/√3 =0.00577 g,因称量时对天平有归零的操作,引入了两次的不确定度,故其相对标准不确定度urel(m)=u(m)/m=0.00577/2.00×√2 =0.00406。2.1.2.5 体积量取引入的不确定度u(V)
操作:用20 mL移液管准确移取1%的醋酸乙腈15.00 mL至50 mL塑料离心管中,再用5 mL移液管准确移取3.00 mL净化液去氮吹至近干,后用1 mL移液管准确移取1.00 mL乙酸乙酯定容上机,其不确定度评定结果见表7。合成相对标准不确定度:
urel(V)=√urel(V25mL)2+urel(V5mL)2+urel(V1mL)2=0.00960 ,其中urel(V25 mL),25 mL移液管的相对标准不确定度;urel(V5 mL),5 mL移液管的相对标准不确定度;urel(V1 mL),1 mL移液管的相对标准不确定度。因实验室温度变化引起溶剂的热胀冷缩而引入的不确定度不能够被忽略(如采用25 mL移液管移取15.00 mL溶剂移液管引入的标准不确定度是0.0578 mL,而溶剂的热胀冷缩引入的标准不确定度是0.0600 mL)。表 7 体积引入的不确定度评定结果Table 7. Uncertainty evaluation results of volume项目 移液管
25 mL移液管
5 mL移液管
1 mL移液体积(mL) 15 3 1 容量允差(mL) 0.1 0.025 0.008 计算公式 0.1/√3 0.025/√3 0.008/√3 标准不确定度u(V)/mL 0.0577 0.0144 0.00462 温度误差(℃) ±5 乙酸乙酯膨胀系数(℃−1) 0.00138 计算公式 0.00138×V×5/√3 标准不确定度u(Vt)/mL 0.0598 0.0199 0.00398 相对标准不确定度urel(V) 0.00554 0.00492 0.00610 2.1.2.6 数字修约引入的不确定度u(A)
绿茶中的三唑磷残留量的检测结果
¯X 为0.112 mg/kg,检测结果保留至小数点后三位,数字修约间隔d=0.001,半宽度为0.5d,按均匀分布处理,则其相对标准不确定度为:urel(A)=0.5d¯X×√3=0.5×0.0010.112×√3=0.00258 。2.1.2.7 仪器稳定性引入的不确定度u(Y)
查GC-MS/MS的校准证书,其扩展不确定度U(Y)为5.5%,故其相对标准不确定度为urel(Y)=U(Y)/k=0.0275。
2.1.3 扩展不确定度
因为各不确定度分量是乘除关系,故可用简易方法进行合成,带入2.1.2的公式中,得urel(X)=0.0552。质控样品绿茶中三唑磷的检测结果平均值
¯X 为0.112 mg/kg,当k取2时,其扩展不确定度U=k×urel(X)ׯX =2×0.0552×0.112=0.012 mg/kg,故采用GUM法评定绿茶中三唑磷残留量的检测结果可表示为:(0.112±0.012) mg/kg,k=2。通过鱼骨图和测量模型可知采用GUM法评定绿茶中三唑磷残留量的不确定度主要来源有7个方面(见图2),其中质量浓度C引入的不确定度分量最大,质量浓度C的不确定度分量包含了标准物质的称量与配制、工作曲线的配制和校准线性拟合三个次分量。分析发现,在线性拟合过程中,当待测物质量浓度在各校准浓度点平均值附近时,其引入的不确定度分量最小。由公式urel(C4)也可以得到验证,当n,p一定时,Cy的质量浓度越靠近ˉC 时,urel(C4)的值就越小,反过来说就是当检测结果越靠近校准曲线的两端,其不确定度越大。在实际操作过程中,为了避免测量不确定度的值过大,对于阳性样品的复测,最好是预估一下待测物的上机质量浓度,而后配制一条让待测物质量浓度在这条校准曲线的平均浓度点附近,同时各浓度点最好是均匀分布在质量浓度轴上。其次是仪器稳定性引入的不确定度,查看校准证书,发现仪器稳定性的最大分量是校准时用的配制好的标准物质溶液,相对标准不确定度为1.5%,其次是10 μL进样针进样1 μL溶液引入的相对标准不确定度是1%,仪器的稳定性对不确定度有很大的贡献,占了约1/4。其他如回收率、重复性测定、定容等引入的不确定度相对较小,虽然本文的检测结果没有校正回收率,其引入的误差被忽略,但是回收率对检测结果是有影响的,其引入的不确定度不能够忽略。绿茶中三唑磷残留量的不确定度分量的主要来源与洪泽淳等[16]、龚珊等[19]的分析是一致的;与李俊等[21]的分析结果类似,不确定度的主要来源是标准曲线拟合、回收率和测量重复性,但李俊等在文中没有对仪器的稳定性进行不确定度分析。2.2 控制图法评定绿茶中三唑磷残留量的不确定度
不同人在不同时间内对绿茶中的三唑磷残留量进行不定期的测定,共汇集了35个有效检测结果,并按时间的先后顺序列入表8的第二列中。
表 8 期间精密度条件下测量结果的A2*统计汇总Table 8.A2* statistical summary of measurement results under the condition of period precision 时序 检测结果(mg/kg) s式计算 MR式计算 Xi |MRi| 原时序 Xi升序 wi pi Ai wi pi Ai 1 0.111 14 0.089 −2.03 0.0212 −8.7033 −2.14 0.01634 −9.3204 2 0.130 0.019 6 0.092 −1.70 0.0442 −16.5367 −1.79 0.03643 −17.4988 3 0.106 0.024 24 0.096 −1.27 0.1020 −23.3785 −1.34 0.09059 −24.6100 4 0.120 0.014 19 0.097 −1.16 0.1226 −31.4388 −1.22 0.11067 −33.0527 5 0.108 0.012 11 0.098 −1.05 0.1461 −38.8479 −1.11 0.13375 −40.7914 6 0.092 0.016 13 0.098 −1.05 0.1461 −47.4807 −1.11 0.13375 −49.8562 7 0.120 0.028 22 0.098 −1.05 0.1461 −45.0064 −1.11 0.13375 −46.8938 8 0.102 0.018 16 0.099 −0.95 0.1723 −49.4505 −0.99 0.15995 −51.4256 9 0.111 0.009 17 0.099 −0.95 0.1723 −51.3362 −0.99 0.15995 −53.2212 10 0.113 0.002 18 0.099 −0.95 0.1723 −54.9958 −0.99 0.15995 −56.9339 11 0.098 0.015 8 0.102 −0.62 0.2677 −51.5321 −0.65 0.25712 −52.9582 12 0.112 0.014 15 0.104 −0.40 0.3436 −48.0204 −0.42 0.33580 −48.9952 13 0.098 0.014 25 0.104 −0.40 0.3436 −52.1961 −0.42 0.33580 −53.2557 14 0.089 0.009 3 0.106 −0.19 0.4263 −50.5475 −0.20 0.42243 −51.3191 15 0.104 0.015 23 0.107 −0.08 0.4691 −48.3688 −0.08 0.46751 −48.8342 16 0.099 0.005 34 0.107 −0.08 0.4691 −51.7046 −0.08 0.46751 −52.2021 17 0.099 0.000 5 0.108 0.03 0.5124 −48.8205 0.03 0.51301 −48.9942 18 0.099 0.000 27 0.108 0.03 0.5124 −48.5417 0.03 0.51301 −48.5440 19 0.097 0.002 35 0.109 0.14 0.5554 −48.3280 0.15 0.55834 −48.1851 20 0.112 0.015 21 0.110 0.25 0.5979 −44.7562 0.26 0.60291 −44.3107 21 0.110 0.002 33 0.110 0.25 0.5979 −47.0514 0.26 0.60291 −46.5830 22 0.098 0.012 1 0.111 0.36 0.6392 −43.1342 0.38 0.64618 −42.3808 23 0.107 0.009 9 0.111 0.36 0.6392 −39.0803 0.38 0.64618 −38.0627 24 0.096 0.011 29 0.111 0.36 0.6392 −40.8172 0.38 0.64618 −39.7544 25 0.104 0.008 12 0.112 0.46 0.6789 −34.2423 0.49 0.68764 −32.9136 26 0.120 0.016 20 0.112 0.46 0.6789 −29.3937 0.49 0.68764 −27.9875 27 0.108 0.012 10 0.113 0.57 0.7167 −27.6750 0.60 0.72685 −26.1460 28 0.115 0.007 28 0.115 0.79 0.7853 −23.6981 0.83 0.79719 −22.0527 29 0.111 0.004 30 0.115 0.79 0.7853 −22.7794 0.83 0.79719 −21.1045 30 0.115 0.004 4 0.120 1.33 0.9086 −14.9700 1.40 0.91959 −13.4174 31 0.120 0.005 7 0.120 1.33 0.9086 −15.4775 1.40 0.91959 −13.8722 32 0.120 0.000 26 0.120 1.33 0.9086 −14.2798 1.40 0.91959 −12.6703 33 0.110 0.010 31 0.120 1.33 0.9086 −13.2205 1.40 0.91959 −11.6214 34 0.107 0.003 32 0.120 1.33 0.9086 −9.4479 1.40 0.91959 −8.1029 35 0.109 0.002 2 0.130 2.42 0.9922 −2.0214 2.54 0.99452 −1.5159 ¯X=0.108 ¯MRi=0.010 A2(s)=0.35 A2(MR)=0.41 s(Xi)=0.0092 sR'=s|MRi|=0.0088 A2*(s)=0.36 A2*(MR)=0.43 注:测量次数n=35。 2.2.1 异常值检验
采用格拉布斯(Grubbs)准则对检测结果进行异常值检验。对35个检测结果进行升序排序,其排序结果见表8。经计算
¯X =0.108 mg/kg,s(x)=0.0092 mg/kg,最大值为X2(0.130 mg/kg),最小值为X14(0.089 mg/kg),G2,max=(0.130−0.108)/0.0092=2.391,G14,min=(0.108−0.089)/0.0092=2.065。查格拉布斯表,在显著水平α=0.01且n=35时,其Gα=0.01(n=35)=3.178,经计算所得的最大值与最小值的Gi值均小于临界值,故检测结果不存在异常值,无需剔除。2.2.2 正态性和独立性检验
正态性和独立性采用统计量的计算方式进行分析,将检测结果按升序排列后,其标准化值(Wi)计算公式:
wi=Xi−ˉXsi ,¯X ,Xi的平均值;si,Xi的标准差,按贝塞尔公式(s式)或移动极差公式(MR式)求得,其中MRi=|Xi+1−Xi| ,¯MR=1.128s(r{'}) 。将标准化值(Wi)换算成正态概率Pi值的计算引用EXCEL 2010中自带的函数“NORM.DIST”,在表格中输入“=NORM.DIST(Wi,平均值,标准偏差,TRUE)”可得。Ai值的计算公式:A1=(2i−1)[ln(pi)−ln(1−pn+1−i)] 。A2和A2*值的计算公式分别为:A2=−∑ni=1Ain−n 和A2∗=A2(1+0.75n+2.25n2) 。经计算可知A2*(s)=0.36<0.752,A2*(MR)=0.43<0.752(见表8),接受测量系统99.5%包含概率下的正态性和独立性假定,可建立控制图对其进一步的分析。2.2.3 移动极差图、系统误差检验与EWMA叠加作图分析
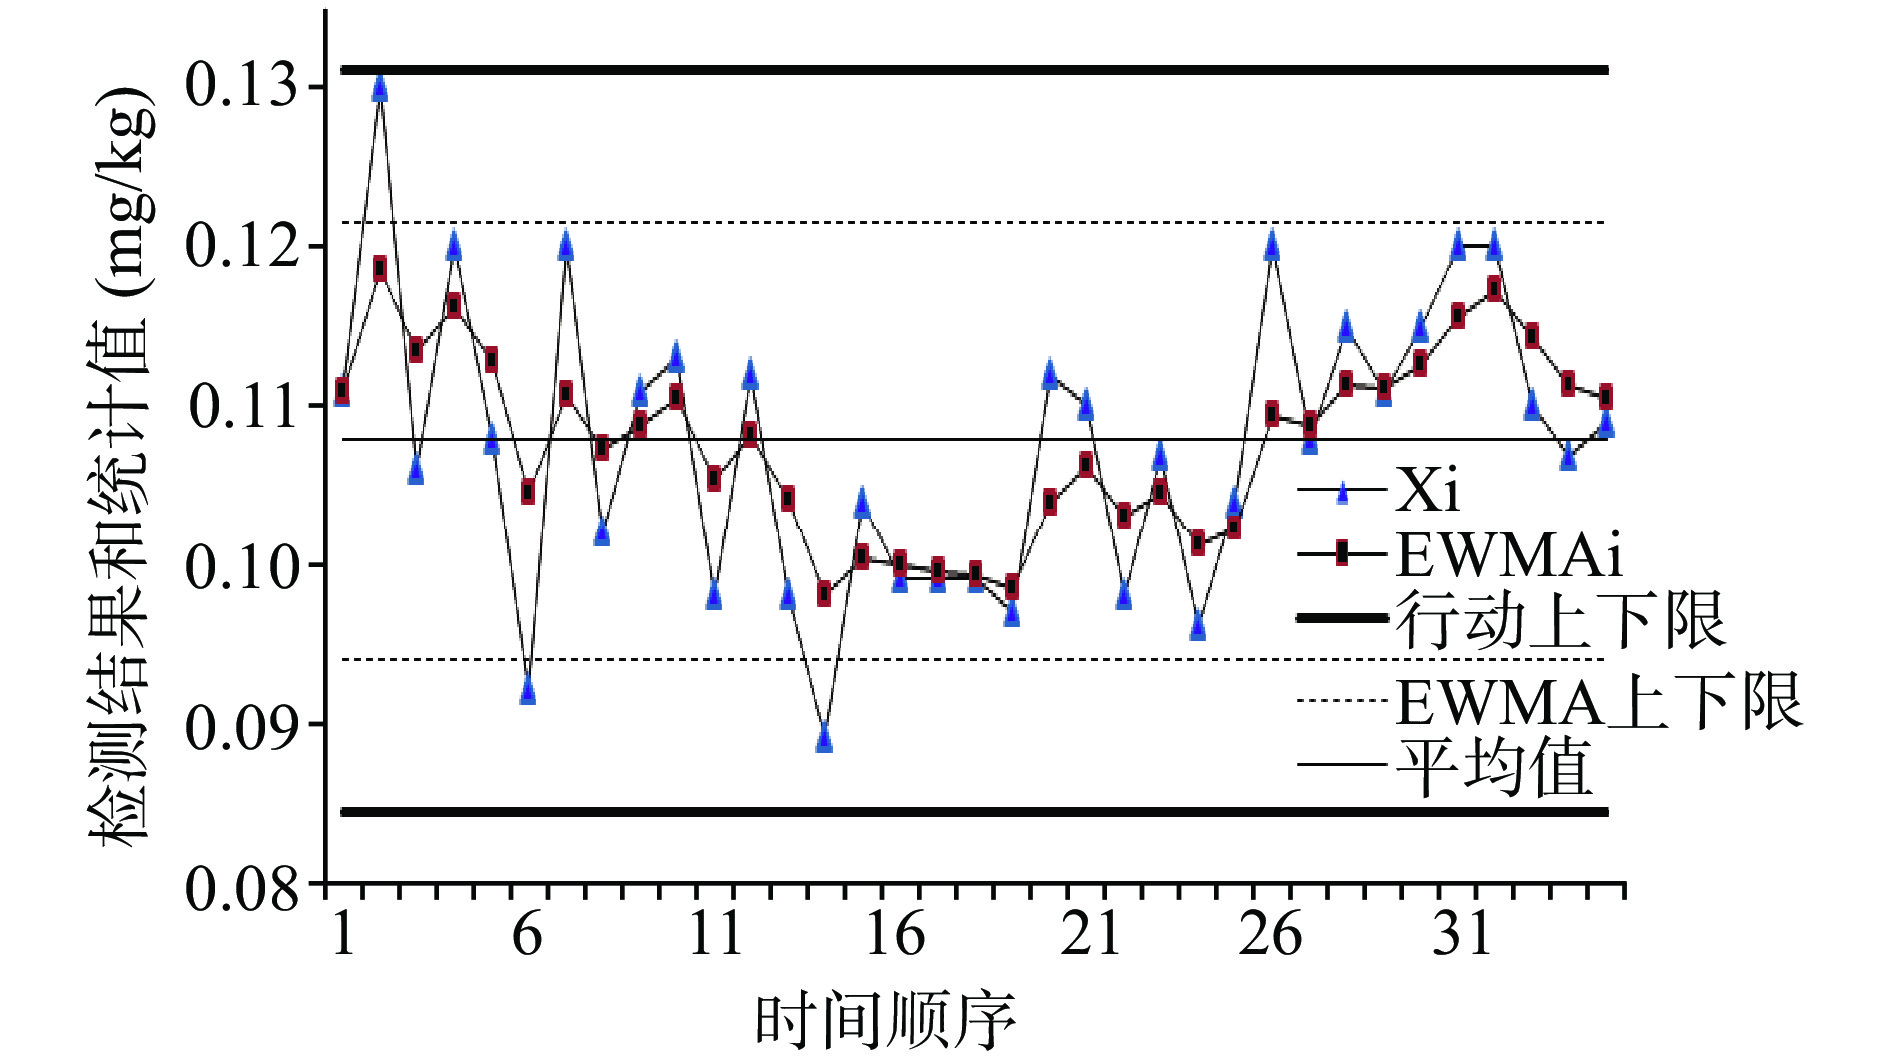
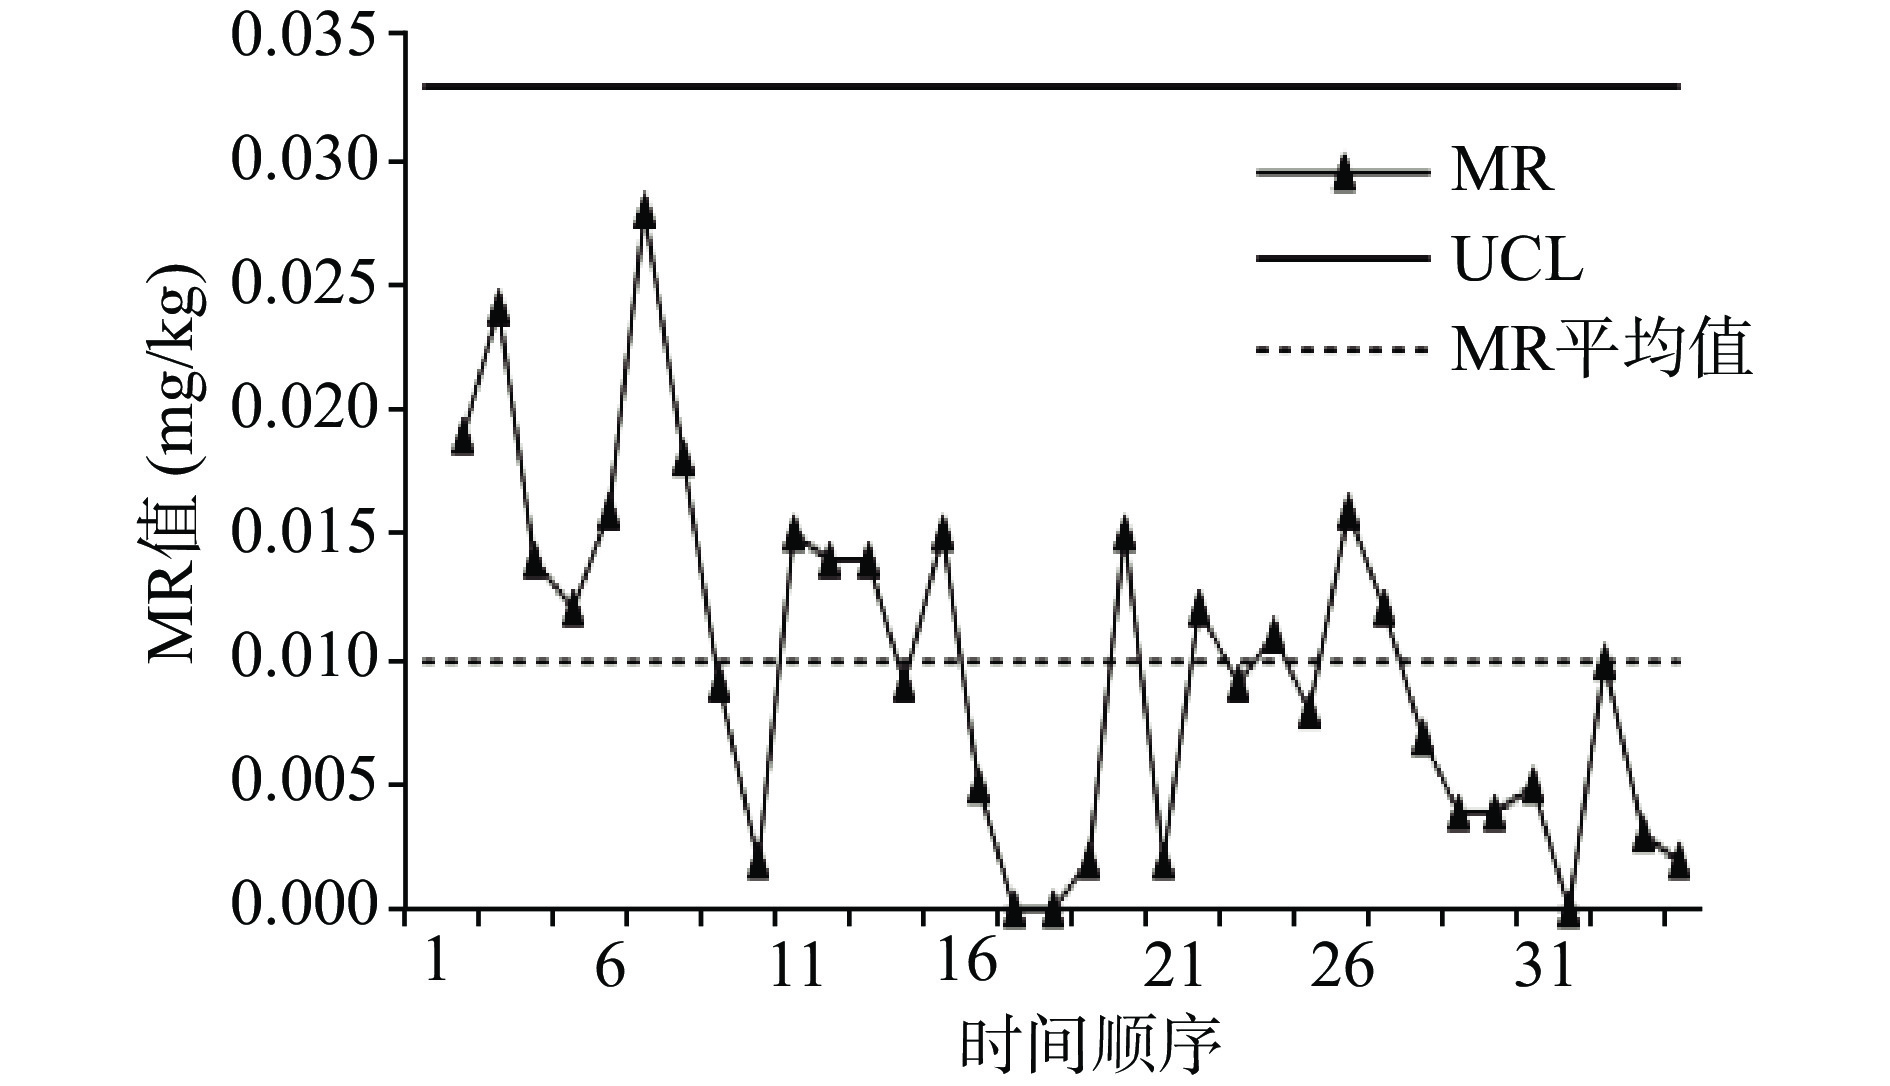
由表5的加标回收率的t检验可知测量系统的偏倚可忽略不计。由表8的结果可以计算Xi的行动限:
UCL=¯X+2.66ׯMR =0.135 mg/kg,LCL=¯X−2.66ׯMR =0.081 mg/kg,UCL和LCL分别为上行动限和下行动限;EWMAi系列值的计算:EWMA1=X1,EWMAi=(1−λ)EWMAi−1+λXi,通常情况下λ值取0.4;EWMA叠加值的UCL和LCL的计算:UCLλ=¯X+3s(r{'})√λ/(2−λ) ,LCLλ=¯X−3s(r')√λ/(2−λ) ,对Xi值与EWMAi值作图(如图2)。MR-图的控制限UCLMR=3.27ׯMR =3.27×0.010=0.033 mg/kg,其没有行动下限,以MR、MR的控制限和MR的平均值作图(如图3)。对图3进行分析可知没有出现GB/T 27407-2010中失控准则规定的5种情况,且EWMAi均没有超出其行动限,可见测量系统仅受随机变异影响的统计假定基本成立[22],图4也说明了测量系统受控。
2.2.4 不确定度评定
经2.2.1~2.2.3的分析,实验室无偏操作的假设是成立的,各检测结果相互独立,且不存在系统偏差,可以以检测结果的平均值0.108 mg/kg作为质控样品的估计值,精密度sR'为不确定度的标准偏差,则对表8中绿茶的三唑磷残留量进行扩展不确定度评定:U=2×sR'=2×0.0088=0.018 mg/kg,绿茶中三唑磷残留量的检测结果可表示为:(0.108±0.018) mg/kg,k=2。
3. 讨论与结论
不确定度评定的方式通常有两种:一种是自下而上的不确定度评定,通常就是指GUM法,也称为Down-Top技术;另外一种是自上而下的不确定度评定,通常有控制图法、精密度法、线性拟合法和经验模型法,称为Top-Down技术。文中采用的控制图法是实验室进行内部质量控制比较常用的一种方法,注重通过一段时间,从整体上去反应一个检测项目在检测过程中包含的不确定度,反映的是长期的期间精密度,充分考察了人员操作的稳定性、环境条件的稳定性、仪器设备的稳定性,有效降低了随机因素对检测结果的影响。通过对检测结果的异常值检验、系统正态性和独立性检验、系统受控状态分析,并作出EWMA图和移动极差图,更加直观地反映检测结果的趋势,更加真实地反映实验室的检测能力。本文对绿茶中三唑磷残留量进行不确定度评定,其扩展不确定度的结果分别为:U=0.012 mg/kg(GUM法)和U=0.018 mg/kg(控制图法),控制图法评定的U值比GUM法大,其可能原因是GUM法体现的是实验室短期内的重复性检测结果及回收率的标准偏差、溶液配制及线性拟合等的经验性估计,不能够体现出检测结果的长期稳定性及整个测量系统是否受控,不能够识别出是否存在系统性缺陷。但是,在实际检验检测活动中无法对阳性样品进行长期性精密度考察,故控制图法的适用范围小于GUM法。GUM法和控制图法都是不确定度评定的常用方法,有其各自的优缺点,检测员需要自己评估并选择合适的不确定度评定方法,使得不确定度评定结果更加客观地反映实验室的检测能力,更加符合客户的实际使用需求。
-
![]()
图 1 气相色谱串联质谱法测定茶叶中三唑磷残留量的不确定度来源
Figure 1. Uncertainty source for determination of triazophos in tea by GC-MS/MS
表 1 储备液稀释过程引入的不确定度
Table 1 Uncertainty resulting from stock solution dilution
项目 移液管
1 mL容量瓶
100 mL容量瓶
10 mL移取体积(mL) 1.00 1.00 1.00 容量允差(mL) 0.008 0.1 0.02 计算公式 0.008/√3 0.1/√6 0.02/√6 相对标准不确定度u(V)/mL 0.00462 0.0408 0.00816 温度误差(℃) ±5 乙酸乙酯膨胀系数(℃−1) 0.00138 计算公式 0.00138×V×5/√3 标准不确定度u(Vt)/mL 0.00690 0.690 0.0690 合成相对标准不确定度urel(V) 0.00830 0.00691 0.00695  下载: 导出CSV
表 2 标准工作曲线制作过程引入的不确定度
Table 2 Uncertainty introduced by the production process of standard working curve
项目 移液器
50 µL移液器
100 µL移液器
200 µL移液器
50 µL移液器
100 µL移液器
200 µL移液体积(mL) 0.040 0.100 0.200 0.040 0.100 0.200 容量允差(mL) ±0.0012 ±0.002 ±0.003 ±0.0012 ±0.002 ±0.003 计算公式 0.0012/√3 0.002/√3 0.003/√3 0.0012/√3 0.002/√3 0.003/√3 不确定度u(Vv)/mL 0.00069 0.00115 0.00173 0.00069 0.00115 0.00173 测量重复性(mL) ±0.00075 ±0.001 ±0.002 ±0.00075 ±0.001 ±0.002 计算公式 0.00075/√3 0.001/√3 0.002/√3 0.00075/√3 0.001/√3 0.002/√3 不确定度u(Vr)/mL 0.000430 0.000580 0.00115 0.000431 0.000582 0.00115 温度误差(℃) ±5 乙酸乙酯膨胀系数(℃−1) 0.00138 计算公式 0.00138×V×5/√3 不确定度u(Vt)/mL 0.000159 0.000398 0.000797 0.000159 0.000398 0.000797 相对合成不确定度urel(V) 0.0208 0.0135 0.0111 0.0208 0.0135 0.0111
下载: 导出CSV
表 3 标准添加工作曲线线性拟合结果
Table 3 Linear fitting results of standard added working curve
标准溶液C(mg/L) 峰面积-1 峰面积-2 峰面积-3 回归方程 决定系数R2 0.008 51995 52004 51848 A=6510276×C−635 0.999 0.020 129998 130009 130139 0.040 259937 260197 259937 0.080 519874 519354 524548 0.200 1299961 1297361 1294766 0.400 2600047 2594847 2620795
下载: 导出CSV
表 4 阳性样品平行检测结果
Table 4 Parallel determination results of positive samples
待测农药 峰面积 质量浓度(mg/L) 平均质量浓度(mg/L) 三唑磷 300125 0.0462 0.0462 301197 0.0464 299998 0.0462
下载: 导出CSV
表 5 绿茶中三唑磷加标回收的不确定度评定结果
Table 5 Uncertainty evaluation results of triazophos recovery in green tea
重复次数 称样量(g) 质量浓度
(mg/L)加标含量
(mg/kg)回收率(%) 1 2.00 0.0411 0.103 102.8 2 1.98 0.0375 0.095 94.7 3 1.99 0.0399 0.100 100.3 4 2.03 0.0412 0.101 101.5 5 2.04 0.0385 0.094 94.4 6 1.99 0.0409 0.103 102.8 7 2.01 0.0394 0.098 98.0 8 2.02 0.0401 0.099 99.3 9 2.00 0.0397 0.099 99.3 10 2.03 0.0423 0.104 104.2 平均值 2.01 0.0401 0.100 99.7 标准偏差 0.0202 0.001402 0.00332 0.0332 标准不确定度 0.00640 0.00044 0.00105 0.0105 相对标准不确定度 0.00319 0.0111 0.0105 0.0105 注:加标水平0.1 mg/kg,重复数n=10。
下载: 导出CSV
表 6 绿茶中三唑磷重复测定的不确定度评定结果
Table 6 Uncertainty evaluation results of repeated determination of triazophos in green tea
n 称样量(g) 质量浓度(mg/L) 含量(mg/kg) 1 2.00 0.0473 0.118 2 1.98 0.0442 0.112 3 1.99 0.0463 0.116 4 2.03 0.0446 0.110 5 2.04 0.0431 0.106 6 1.99 0.0432 0.109 7 2.01 0.0432 0.107 8 2.02 0.0472 0.117 9 2.00 0.0469 0.117 10 2.03 0.0433 0.107 平均值 2.01 0.0449 0.112 标准偏差 0.0202 0.00180 0.00489 不确定度 0.00640 0.00057 0.00155 相对标准不确定度 0.00319 0.0127 0.0138 注:重复次数n=10。
下载: 导出CSV
表 7 体积引入的不确定度评定结果
Table 7 Uncertainty evaluation results of volume
项目 移液管
25 mL移液管
5 mL移液管
1 mL移液体积(mL) 15 3 1 容量允差(mL) 0.1 0.025 0.008 计算公式 0.1/√3 0.025/√3 0.008/√3 标准不确定度u(V)/mL 0.0577 0.0144 0.00462 温度误差(℃) ±5 乙酸乙酯膨胀系数(℃−1) 0.00138 计算公式 0.00138×V×5/√3 标准不确定度u(Vt)/mL 0.0598 0.0199 0.00398 相对标准不确定度urel(V) 0.00554 0.00492 0.00610
下载: 导出CSV
表 8 期间精密度条件下测量结果的A2*统计汇总
Table 8
A2* statistical summary of measurement results under the condition of period precision 时序 检测结果(mg/kg) s式计算 MR式计算 Xi |MRi| 原时序 Xi升序 wi pi Ai wi pi Ai 1 0.111 14 0.089 −2.03 0.0212 −8.7033 −2.14 0.01634 −9.3204 2 0.130 0.019 6 0.092 −1.70 0.0442 −16.5367 −1.79 0.03643 −17.4988 3 0.106 0.024 24 0.096 −1.27 0.1020 −23.3785 −1.34 0.09059 −24.6100 4 0.120 0.014 19 0.097 −1.16 0.1226 −31.4388 −1.22 0.11067 −33.0527 5 0.108 0.012 11 0.098 −1.05 0.1461 −38.8479 −1.11 0.13375 −40.7914 6 0.092 0.016 13 0.098 −1.05 0.1461 −47.4807 −1.11 0.13375 −49.8562 7 0.120 0.028 22 0.098 −1.05 0.1461 −45.0064 −1.11 0.13375 −46.8938 8 0.102 0.018 16 0.099 −0.95 0.1723 −49.4505 −0.99 0.15995 −51.4256 9 0.111 0.009 17 0.099 −0.95 0.1723 −51.3362 −0.99 0.15995 −53.2212 10 0.113 0.002 18 0.099 −0.95 0.1723 −54.9958 −0.99 0.15995 −56.9339 11 0.098 0.015 8 0.102 −0.62 0.2677 −51.5321 −0.65 0.25712 −52.9582 12 0.112 0.014 15 0.104 −0.40 0.3436 −48.0204 −0.42 0.33580 −48.9952 13 0.098 0.014 25 0.104 −0.40 0.3436 −52.1961 −0.42 0.33580 −53.2557 14 0.089 0.009 3 0.106 −0.19 0.4263 −50.5475 −0.20 0.42243 −51.3191 15 0.104 0.015 23 0.107 −0.08 0.4691 −48.3688 −0.08 0.46751 −48.8342 16 0.099 0.005 34 0.107 −0.08 0.4691 −51.7046 −0.08 0.46751 −52.2021 17 0.099 0.000 5 0.108 0.03 0.5124 −48.8205 0.03 0.51301 −48.9942 18 0.099 0.000 27 0.108 0.03 0.5124 −48.5417 0.03 0.51301 −48.5440 19 0.097 0.002 35 0.109 0.14 0.5554 −48.3280 0.15 0.55834 −48.1851 20 0.112 0.015 21 0.110 0.25 0.5979 −44.7562 0.26 0.60291 −44.3107 21 0.110 0.002 33 0.110 0.25 0.5979 −47.0514 0.26 0.60291 −46.5830 22 0.098 0.012 1 0.111 0.36 0.6392 −43.1342 0.38 0.64618 −42.3808 23 0.107 0.009 9 0.111 0.36 0.6392 −39.0803 0.38 0.64618 −38.0627 24 0.096 0.011 29 0.111 0.36 0.6392 −40.8172 0.38 0.64618 −39.7544 25 0.104 0.008 12 0.112 0.46 0.6789 −34.2423 0.49 0.68764 −32.9136 26 0.120 0.016 20 0.112 0.46 0.6789 −29.3937 0.49 0.68764 −27.9875 27 0.108 0.012 10 0.113 0.57 0.7167 −27.6750 0.60 0.72685 −26.1460 28 0.115 0.007 28 0.115 0.79 0.7853 −23.6981 0.83 0.79719 −22.0527 29 0.111 0.004 30 0.115 0.79 0.7853 −22.7794 0.83 0.79719 −21.1045 30 0.115 0.004 4 0.120 1.33 0.9086 −14.9700 1.40 0.91959 −13.4174 31 0.120 0.005 7 0.120 1.33 0.9086 −15.4775 1.40 0.91959 −13.8722 32 0.120 0.000 26 0.120 1.33 0.9086 −14.2798 1.40 0.91959 −12.6703 33 0.110 0.010 31 0.120 1.33 0.9086 −13.2205 1.40 0.91959 −11.6214 34 0.107 0.003 32 0.120 1.33 0.9086 −9.4479 1.40 0.91959 −8.1029 35 0.109 0.002 2 0.130 2.42 0.9922 −2.0214 2.54 0.99452 −1.5159 ¯X=0.108 ¯MRi=0.010 A2(s)=0.35 A2(MR)=0.41 s(Xi)=0.0092 sR'=s|MRi|=0.0088 A2*(s)=0.36 A2*(MR)=0.43 注:测量次数n=35。
下载: 导出CSV
-
[1] BHARDWAJ A K, CHANDRA R K, TRIPATHI M K. Analysis of suppressive effects of pesticide triazophos on leucocyte immune responses in a teleost, Channa punctatus[J]. Drug and Chemical Toxicology,2021(1):1−8.
[2] 张朝伦. 植物化学保护[M]. 中国农业出版社, 2011: 231−250. ZHANG C L. Phytochemical protection[M]. China Agricultural Press, 2011: 231−250.
[3] 农业农村部农药检定所药情信息处. 农药登记数据[DB/OL]. 中华人民共和国农业农村部农药检定所, ( 2022-03-04 ) [2022-03-25]. http://www.icama.org.cn/hysj/index.jhtml. Department of drug information, Institute of pesticide control, Ministry of agriculture and rural areas. Pesticide registration data[DB/OL]. Institute for pesticide control, Ministry of agriculture and rural areas of the People's Republic of China, (2022-03-04)[2022-03-25].
[4] 夏雨. 国家农业部决定对氯磺隆等农药采取进一步禁限用措施[J]. 农业知识: 致富与农资,2014(4):61−62. [XIA Y. The ministry of agriculture of the People's Republic of China has decided to further ban and restrict the use of chlorsulfuron and other pesticides[J]. Agricultural knowledge: Getting Rich and Agricultural Materials,2014(4):61−62. [5] 中华人民共和国国家卫生健康委员, 中华人民共和国农业农村部, 国家市场监督管理总局. GB 2763-2021 食品安全国家标准 食品中农药最大残留限量[S]. 北京: 中国农业出版社, 2021: 281−282. National Health and Family Planning Commission, Ministry of agriculture and rural development of the people's Republic of China, the State Administration for Market Regulation. GB 2763-2021 Food safety national standard. Pesticide maximum residue limits[S]. Beijing: China Agricultural Press, 2021: 281−282.
[6] TONG X L. Residue status analysis and controlling measures of triazophos of export tea[J]. Journal of Inspection & Quarantine,2012,22(5):33−35.
[7] CHEN H, HAO Z, WANG Q, et al. Occurrence and risk assessment of organ phosphorus pesticide residues in Chinese tea[J]. Human & Ecological Risk Assessment,2016,22(2):28−38.
[8] KUMARI D, JOHN S. Health risk assessment of pesticide residues in fruits and vegetables from farms and markets of Western Indian Himalayan region[J]. Chemosphere,2019,224(JUN.):162−167.
[9] 戴德江, 林荣华, 沈瑶, 等. 加强三唑磷风险管控的对策措施及建议[J]. 农药市场信息,2017,38(9):1−9. [DAI D J, LIN R H, SHEN Y, et al. Suggestions and countermeasures of strengthening risk management on triazophos[J]. Pesticide Market Information,2017,38(9):1−9. doi: 10.13378/j.cnki.pmn.2018.01.017 [10] 陈红平, 刘新, 鲁成银, 等. 茶叶内含物质与外源污染物在冲泡过程中的浸出规律[J]. 茶叶科学,2020,40(1):63−76. [CHEN H P, LIU X, LU C Y, et al. Leaching pattern of internal substances and xenobiotic pollutants during tea brewing[J]. Journal of Tea Science,2020,40(1):63−76. doi: 10.3969/j.issn.1000-369X.2020.01.006 [11] 中国国家认证认可监督管理委员会. RB/T 216-2017 检验检测机构资质认定能力评价 食品复检机构要求[S]. 北京: 中国质检出版社, 2018. National Certification and Accreditation Administration. RB/T 216-2017 Evaluation of qualification recognition ability of inspection and testing institutions. Requirements for food re-inspection institutions[S]. Beijing: China Quality Inspection Press, 2018.
[12] 安平, 刘浩峰, 华广胜. 检测实验室测量不确定度评定与应用现状[J]. 中国检验检测,2018,26(6):60−63. [AN P, LIU H F, HUA G S. The Status quo of evaluation and application of measurement uncertainty in testing laboratories[J]. China Inspection Body & Laboratory,2018,26(6):60−63. [13] CAROBBI C F M, LALLÉCHÈRE S, ARNAUT L R. Review of uncertainty quantification of measurement and computational modeling in emc part i: Measurement uncertainty[J]. IEEE Transactions on Electromagnetic Compatibility,2019,61(6):1690−1698. doi: 10.1109/TEMC.2019.2904973
[14] Italian Standards. Guide to the expression of uncertainty in measurement[S]. Measurement Uncertainty, 2008, 30 ( 1 ) : 105−107.
[15] 刁银军, 刘莉, 肖珊美, 等. UPLC-MS/MS法测定元胡中4种有机磷农药残留的不确定度评定[J]. 安徽农业科学,2018,46(6):157−161. [DIAO Y J, LIU L, XIAO S M, et al. Uncertainty evaluation of determination of organic organ phosphorus residues in Corydalis yanhusuo by UPLC-MS/MS[J]. Journal of Anhui Agricultural Sciences,2018,46(6):157−161. doi: 10.3969/j.issn.0517-6611.2018.06.042 [16] 洪泽淳, 熊含鸿, 刘莹莹, 等. 气相色谱法测定蔬菜中16种有机磷农药残留量的测量不确定度评定[J]. 食品工业科技,2020,41(3):239−245. [HONG Z C, XIONG H H, LIU Y Y, et al. Evaluation of measurement uncertainty in the determination of 16 kinds of organ phosphorus pesticide residues in vegetables by gas chromatography[J]. Science and Technology of Food Industry,2020,41(3):239−245. doi: 10.13386/j.issn1002-0306.2020.03.040 [17] 李清. 气相色谱仪测定蔬菜中农药残留的测量不确定度评定及质量判定[J]. 榆林学院学报,2020,30(6):32−37. [LI Q. Evaluation of measurement uncertainty and quality determination of pesticide residues in vegetables by gas chromatograph[J]. Journal of Yulin University,2020,30(6):32−37. [18] 蒋永祥, 叶丽. 茶叶中多种有机磷农药残留量测定不确定度的评定[J]. 分析试验室,2006(12):54−57. [JIANG Y X, YE L. Evaluation of uncertainty in the determination of organ phosphorus pesticide residues in tea[J]. Chinese Journal of Analysis Laboratory,2006(12):54−57. doi: 10.3969/j.issn.1000-0720.2006.12.014 [19] 龚珊, 任正东, 刘旭, 等. 气相色谱-质谱法检测谷物中三唑磷残留量的测量不确定度评定[J]. 粮食与饲料工业,2019(6):57−60. [GONG S, REN Z D, LIU X, et al. Uncertainty evaluation of determination of triazophos in cereal by gas chromatography-mass spectrometry[J]. Cereal & Feed Industry,2019(6):57−60. [20] 林雨滋. 黄瓜中三唑磷农药残留的不确定度评定及质量判定[J]. 化工管理,2021(3):111−112. [LIN Y Z. Uncertainty evaluation and quality determination of triazophos pesticide residues in cucumber[J]. Chemical Management,2021(3):111−112. [21] 李俊, 蔡滔, 代虹镜, 等. 基于气相色谱质谱法测定茶叶中哒螨灵等9种农药残留量的测量不确定度评定[J]. 食品工业科技,2022,43(14):311−322. [LI J, CAI T, DAI H J, et al. Evaluation of measurement uncertainty for the determination of pyridaben and other nine pesticide residues in tea by gas chromatography-mass spectrometry[J]. Science and Technology of Food Industry,2022,43(14):311−322. doi: 10.13386/j.issn1002-0306.2021090073 [22] 中华人民共和国国家质量监督检验检疫总局, 中国国家标准化管理委员会. GB/T 27407-2010 实验室质量控制 利用统计质量保证和控制图技术 评价分析测量系统的性能[S]. 北京: 中国标准出版社, 2014. National Standardization Management Committee, General Administration of Quality Supervision, Inspection and Quarantine. GB/T 27407-2010 Laboratory quality control. Using statistical quality assurance and control chart technology to evaluate the performance of analytical measurement system[S]. Beijing: China Standards Press, 2014.
-
期刊类型引用(4)
1. 黄潇漪,贾利蓉,孙玉鼎,曹月刚,冉旭. 天然香辛料对烘炒花生仁货架期品质的影响. 食品工业科技. 2024(12): 285-293 .  本站查看
本站查看
2. 魏甜甜,魏勃,王承,李凯,谢彩锋,杭方学. 黄冰糖低温浸渍茉莉花制备风味糖浆工艺优化. 食品工业科技. 2022(12): 181-187 . 本站查看
3. 邹林武,姜福全,戚智胜. 白冰糖提取玫瑰花风味的工艺研究. 现代食品. 2022(15): 94-96+117 . 百度学术
4. 宣晓婷,陈思媛,乐耀元,尚海涛,曾昊溟,凌建刚,张文媛. 高水分南美白对虾虾干货架期预测模型的构建. 农产品加工. 2022(19): 78-82+90 . 百度学术
其他类型引用(7)

 下载:
下载:


计量
- 文章访问数: 163
- HTML全文浏览量: 39
- PDF下载量: 14
- 被引次数: 11
目录
1. 材料与方法
1.1 材料与仪器
1.2 实验方法
1.2.1 样品前处理
1.2.2 仪器条件
1.2.3 结果计算
1.3 数据处理
1.3.1 GUM法
1.3.2 控制图法
2. 结果与分析
2.1 GUM法评定绿茶中三唑磷残留量的不确定度
2.1.1 不确定度来源分析
2.1.2 各标准不确定度分量的评定
2.1.2.1 被测物的质量浓度C引入的不确定度
2.1.2.2 测量回收率产生的不确定度u (R)
2.1.2.3 测量重复性产生的不确定度u(
¯X )2.1.2.4 试样称量引入的不确定度u(m)
2.1.2.5 体积量取引入的不确定度u(V)
2.1.2.6 数字修约引入的不确定度u(A)
2.1.2.7 仪器稳定性引入的不确定度u(Y)
2.1.3 扩展不确定度
2.2 控制图法评定绿茶中三唑磷残留量的不确定度
2.2.1 异常值检验
2.2.2 正态性和独立性检验
2.2.3 移动极差图、系统误差检验与EWMA叠加作图分析
2.2.4 不确定度评定
3. 讨论与结论

