Quantitative Analysis of Three Amines in Thermally Processed Meat Products Using QuEChERS Combined with UHPLC-MS/MS
-
摘要: 本文采用QuEChERS技术结合超高效液相色谱-串联质谱(UHPLC-MS/MS)技术建立同时检测丙烯酰胺(AA)、亚硝胺(NAs)和杂环胺(HAAs)含量的方法,用于分析热加工肉制品中产生的胺类物质。结果表明:该方法检测出的三类成分20种胺类物质在相应浓度范围内显示出良好的线性关系(R2>0.991),检测限和定量限分别为0.01~1.6 ng/g和0.03~4.8 ng/g,日内回收率介于66.3%~116.5%之间,日内精密度介于0.78%~9.0%之间。每个胺类物的5×LOQ加标水平计算的日间精度范围为3.4%~9.4%。该方法应用于煎烤的四种肉制品中AA、NAs和HAAs的分析,共检测出9种胺类物质,浓度范围为0.03~31.26 ng/g。Abstract: In this study, QuEChERS technology combined with ultra-high performance liquid chromatography-tandem mass spectrometry (UHPLC-MS/MS) was used to establish a method for the simultaneous detection of acrylamide (AA), nitrosamines (NAs) and heterocyclic amines (HAAs) in thermally processed meat products. The results showed that the analytic methods of 20 amines in the three components showed good linearity (R2>0.991) in the corresponding concentration range, and the detection limit and quantification limit were 0.01~1.6 ng/g and 0.03~4.8 ng/g, respectively. The average daily recovery rate was between 66.3%~116.5%, and the intraday precision was between 0.78%~9.0%. The daily accuracy range of the 5×LOQ spiked level calculation for each amine was 3.4%~9.4%. The method was applied to the analysis of AA, NAs and HAAs in four meat products for grilling, in them 9 amines were detected with the concentration range of 0.03~31.26 ng/g.
-
Keywords:
- acrylamide /
- heterocyclic amines /
- nitrosamines /
- thermally processed meat products
-
肉及肉制品能够提供多种营养物质,是人们日常饮食中的重要组成部分[1]。人们每天食用100 g肉制品就能满足每日推荐量(RDA)50%的铁、锌、硒、维生素B12、维生素B6和100%的维生素A[2-3]。其中的必需氨基酸、高品质蛋白质、锌、铁、硒和牛磺酸、肉碱、肌酸等生物活性物质,对人体健康十分有益[4-6]。但是,热加工肉制品时容易产生一些有毒有害的物质,比如相关研究表明,我国肉制品传统加工方式烧烤、油炸、煎炸和酱卤中,高温加工产生大量致癌物丙烯酰胺(AA)、亚硝胺(NAs)和杂环胺(HAAs)等[7]。它们通过食物摄入人体后,会通过胃肠道迅速吸收,并通过血液循环系统在肝脏、肾脏、胸腺和心脏等器官聚集,对人类健康造成不利影响[8-9]。国际癌症研究机构已将部分HAAs和NAs归类为2B类人体致癌物,而IQ和AA被列为2A类人体致癌物[10-11]。
近年来,文献报道了一些使用GC[12]、GC-MS[13]、LC[14]、GC-MS[15]、LC-UVD[16]和LC-MS/MS[17-18]分析胺类物质的方法,其中采用GC-MS进行AA和HAAs的测定方法通常需要繁琐的衍生化处理。LC-MS和LC-MS/MS是目前最常用的方法,因为这些方法无需衍生化处理即可对复杂基质中的某种胺类物质进行分离和测定[19]。然而,目前缺乏对热加工肉制品中主要胺类物质统一快速准确的分析方法。因此,本研究目标建立一种稳定且灵敏的方法用于热加工肉制品中AA、NAs和HAAs等20种胺类物质的痕量分析。该方法采用简单、快速的乙腈盐析均相萃取,通过LC-MS/MS进行测定,可应用于烧烤、油炸和煎烤等不同肉制品中AA、NAs和HAAs的分析。
1. 材料与方法
1.1 材料与仪器
新鲜屠宰的猪肉里脊、牛肉里脊、鸡胸肉和羊后腿肉 购自沈阳市二台子清真牛羊屠宰厂(沈阳市绿洲生猪屠宰场和沈阳华美畜禽有限公司);杂环胺类:2-氨基-1,6-二甲基咪唑并吡啶(DMIP)、2-氨基-3-甲基-3H-咪唑并[4,5-f]喹噁啉(IQx)、2-氨基-3-甲基-3H-咪唑并喹啉(IQ)、2-氨基-3,8-二甲基咪唑并[4,5-f]喹恶啉(MeIQx)、2-氨基-3,7,8-三甲基-3H-咪唑并[4,5-f]喹噁啉(7,8-DiMeIQx)、2-氨基-3,4,8-三甲基-3H-咪唑[4,5-f]喹喔啉(4,8-DiMeIQx)、9H-吡啶并[3,4-b]吲哚(Norharman)、哈尔满碱(Harman)、3-氨基-1-甲基-5H-吡啶[4,3-b]吲哚(TRP-P-2)、2-氨基-1-甲基-6-苯基咪唑[4,5-b]吡啶(PHIP)、3-氨基-1,4-二甲基-5h-吡啶[4,3-b]吲哚乙酸(Trp-P-1)、2-氨基-9H-吡啶并[2,3-b]吲哚-15N3(AaC)、2-氨基-3,4-二甲基-3H-咪唑并喹啉(MeIQ)、内标:Nroharman-d7、4,7,8-TriMeIQx(纯度为99%) Toronto Research Chemicals公司;丙烯酰胺:AA,纯度为99% 阿拉丁化学试剂有限公司;亚硝胺类:N-亚硝基二苯胺(N-nitrosodiphenylamine,NDPHA)、N-亚硝基二丙胺(N-nitrosodipropylamine,NDPA)、N-亚硝基二丁胺(N-nitrosodibutylamine,NDBA)、N-亚硝基哌啶(N-nitrosopiperidine,NPIP)、N-亚硝基吡咯烷(N-nitrosopyrrolidine,NPYR)、N-亚硝基吗啉(N-nitrosomorpholine,NMOR),纯度为99% 麦克林化学试剂有限公司;正己烷、乙腈、甲醇 色谱纯,上海Sigma公司;PSA、HC-C18净化剂 上海安谱实验科技有限公司;整个实验使用Milli-Q净水系统生产的超纯水。
CR21N(立式)高速冷冻离心机 日本日立株式会社;Lab Dancer涡旋混匀器 德国IKA公司;Waters超高液相色谱-质谱联用仪(配有电喷雾离子源(ESI)及Masslynx V4.1数据处理系统) 美国Waters公司;FSH-2A高速均质机 上海康敏检验设备有限公司;Milli-Q超纯水机 美国Millipore公司;MP-2002型分析天平 上海舜宇恒平科学仪器有限公司;ACQUITY UPLC BEH C18柱 上海沃特世科技有限公司;Extend C18柱和EclipsePlus C18柱 中国安捷伦科技有限公司。
1.2 实验方法
1.2.1 标准溶液的制备
500 μg/mL的单个AA、NAs、HAAs及内标标准母液用乙腈配制。通过乙腈稀释母液获得混合标准储备溶液、混合内标储备溶液(5.0 mg/L)和标准溶液(1 mg/L)。使用前,将混合标准储备溶液用流动相(1 mmol/L乙酸铵0.06%甲酸/乙腈,95/5,v/v)稀释成浓度为0.1、0.5、1.0、5.0、10.0、20.0、100.0 µg/L的混合标准工作溶液,所有混合标准工作溶液都含有20 µg/L的4,7,8-TriMeIQx和Norharman-d7。
1.2.2 样品的制备
原料肉洗净,修整,去除表面可见的脂肪和筋膜组织。原料肉切成(5.0 cm×3.0 cm×0.3 cm)立方体,将约1 kg的木炭放在烤炉上,将50 mL汽油倒在煤炭上生火,在烤炉上方放上平底锅,在230 °C以不同时间(3、5和7 min)煎制。未处理的肉样作为对照组。肉样处理后均已达到可食用熟度。且在整个处理过程中未添加香辛料和食品添加剂等佐料。肉品处理后冷却,切成小颗粒(0.2 cm×0.2 cm×0.2 cm),真空包装在尼龙塑料袋中,−80 °C下储存。
1.2.3 样品的处理
取2 g均匀肉样加入50 mL离心管中,分次加入5 mL正己烷涡旋除脂。将4 µL的混合内标储备溶液和4 µL混合标准储备液依次加入离心管。加入4 mL氢氧化钠溶液(1 mmol/L)和6 mL的乙腈均质,涡旋分散并超声。加入2 g NaCl和2 g Na2SO4至离心管,涡旋。以4000 r/min离心3 min,收集上清液,4 mL的乙腈重提,合并上清液。旋转蒸发仪浓缩到0.5 mL,用流动相(1 mmol/L乙酸铵0.06%甲酸/乙腈,95/5,v/v)稀释到1 mL,涡旋2 min,溶液转移至装有50 mg PSA的2 mL离心管中,以12000 r/min离心3 min,上清液过0.22 µm的滤膜,待分析。
1.2.4 检测仪器条件
AA、NAs和HAAs的色谱分离在安捷伦Eclipse C18柱(2.1 mm×50 mm,1.8 µm)上进行,柱温为30 °C。流动相由溶剂A(1 mmol/L乙酸铵0.06%甲酸)和溶剂B(乙腈)组成。流速为0.2 mL/min,采用以下线性梯度洗脱程序:0~0.2 min,5% B;0.2~3.0 min,5%~40% B;3.0~7.0 min,40%~100% B;7.0~8.0 min,100% B;8.0~9.0 min,100%~5% B;9.0~12.0 min,5% B。进样量为3 μL。
ESI以正模式进行,优化工作参数如下:毛细管电压:0.8 kV;锥孔电压:30 V;离子源温度:100 °C;脱溶剂气温度:650 °C;脱溶剂气(N2)流量:1000 L/h;锥孔气(N2)流量:3 L/h;MS/MS分析采用多反应监测(MRM)模式。目标分析物和两种内标的保留时间、最佳碰撞能量和MRM离子对等信息如表1所示。
表 1 AA、NAs、HAAs的质谱条件Table 1. MS conditions of AA, NAs and HAAs化合物 保留时间(min) 锥孔电压(V) MRM离子对(m/z) 碰撞电压(V) AA 0.84 35 72.13/55.27*
72.13/43.9310
10DMIP 2.34 48 162.96/148.05*
162.96/105.20322
32IQx 3.02 58 199.98/185.08*
199.98/131.1226
38IQ 2.51 56 198.90/184.07
198.90/130.0028
40MeIQ 2.86 52 212.97/198.01*
212.97/116.8724
50MeIQx 3.38 54 213.97/130.97*
213.97/199.0238
267,8-DiMeIQx 3.65 60 228.00/213.06*
228.00/131.0326
384,8-DiMeIQx 3.65 54 227.94/212.94*
227.94/144.8322
38Norharman 3.76 60 168.95/141.99*
168.95/89.0126
42Harman 3.93 58 182.90/114.97*
182.90/167.9432
26TRP-P-2 4.13 56 197.97/127.59*
197.97/77.0928
48PHIP 4.15 58 224.97/210.03*
224.97/114.7128
48TRP-P-1 4.28 56 211.98/179.19*
211.98/115.0438
44AaC 4.42 46 183.91/157.003*
183.91/88.9520
46NPYR 2.22 4 100.85/55.12*
100.85/40.0025
15NDPA 5.77 24 130.97/89.08*
130.97/42.858
13NDPHA 7.12 28 199.09/169.10*
199.09/74.1010
12NDBA 6.98 28 158.97/102.99*
158.97/56.9510
13NMOR 1.72 30 117/45*
117/8718
18NPIP 4.07 30 115/41*
115/6916
124,7,8-TriMeIQx 3.87 54 241.87/145.01 40 Norharman-d7 3.73 62 176.03/120.37 30 注:*为定量离子。 1.2.5 样品中胺类物质的定性和定量分析
利用色谱图中对应的保留时间和MRM离子对对被检胺类物质进行定性。用阴性样品的基质提取液和纯溶剂配制相同浓度的基质匹配校准溶液和标准溶液,按照上述检测条件检测,AA和NAs以标准品浓度x(ng/mL)为横坐标,各组分的峰面积y为纵坐标绘制标准曲线,采用外标法对其浓度进行定量。HAAs以标准品浓度x(ng/mL)为横坐标,各组分的峰面积与内标峰面积比值y为纵坐标,绘制标准曲线,采用内标法对其浓度进行定量。
1.3 数据处理
所有试验均重复3次,试验结果以平均值±标准差表示;20种胺类物质的色谱图采用Masslynx V4.1软件进行分析;其他数据使用Microsoft Excel 2019进行处理,并使用Origin 2018软件绘制图表。
2. 结果与分析
2.1 流动相的优化
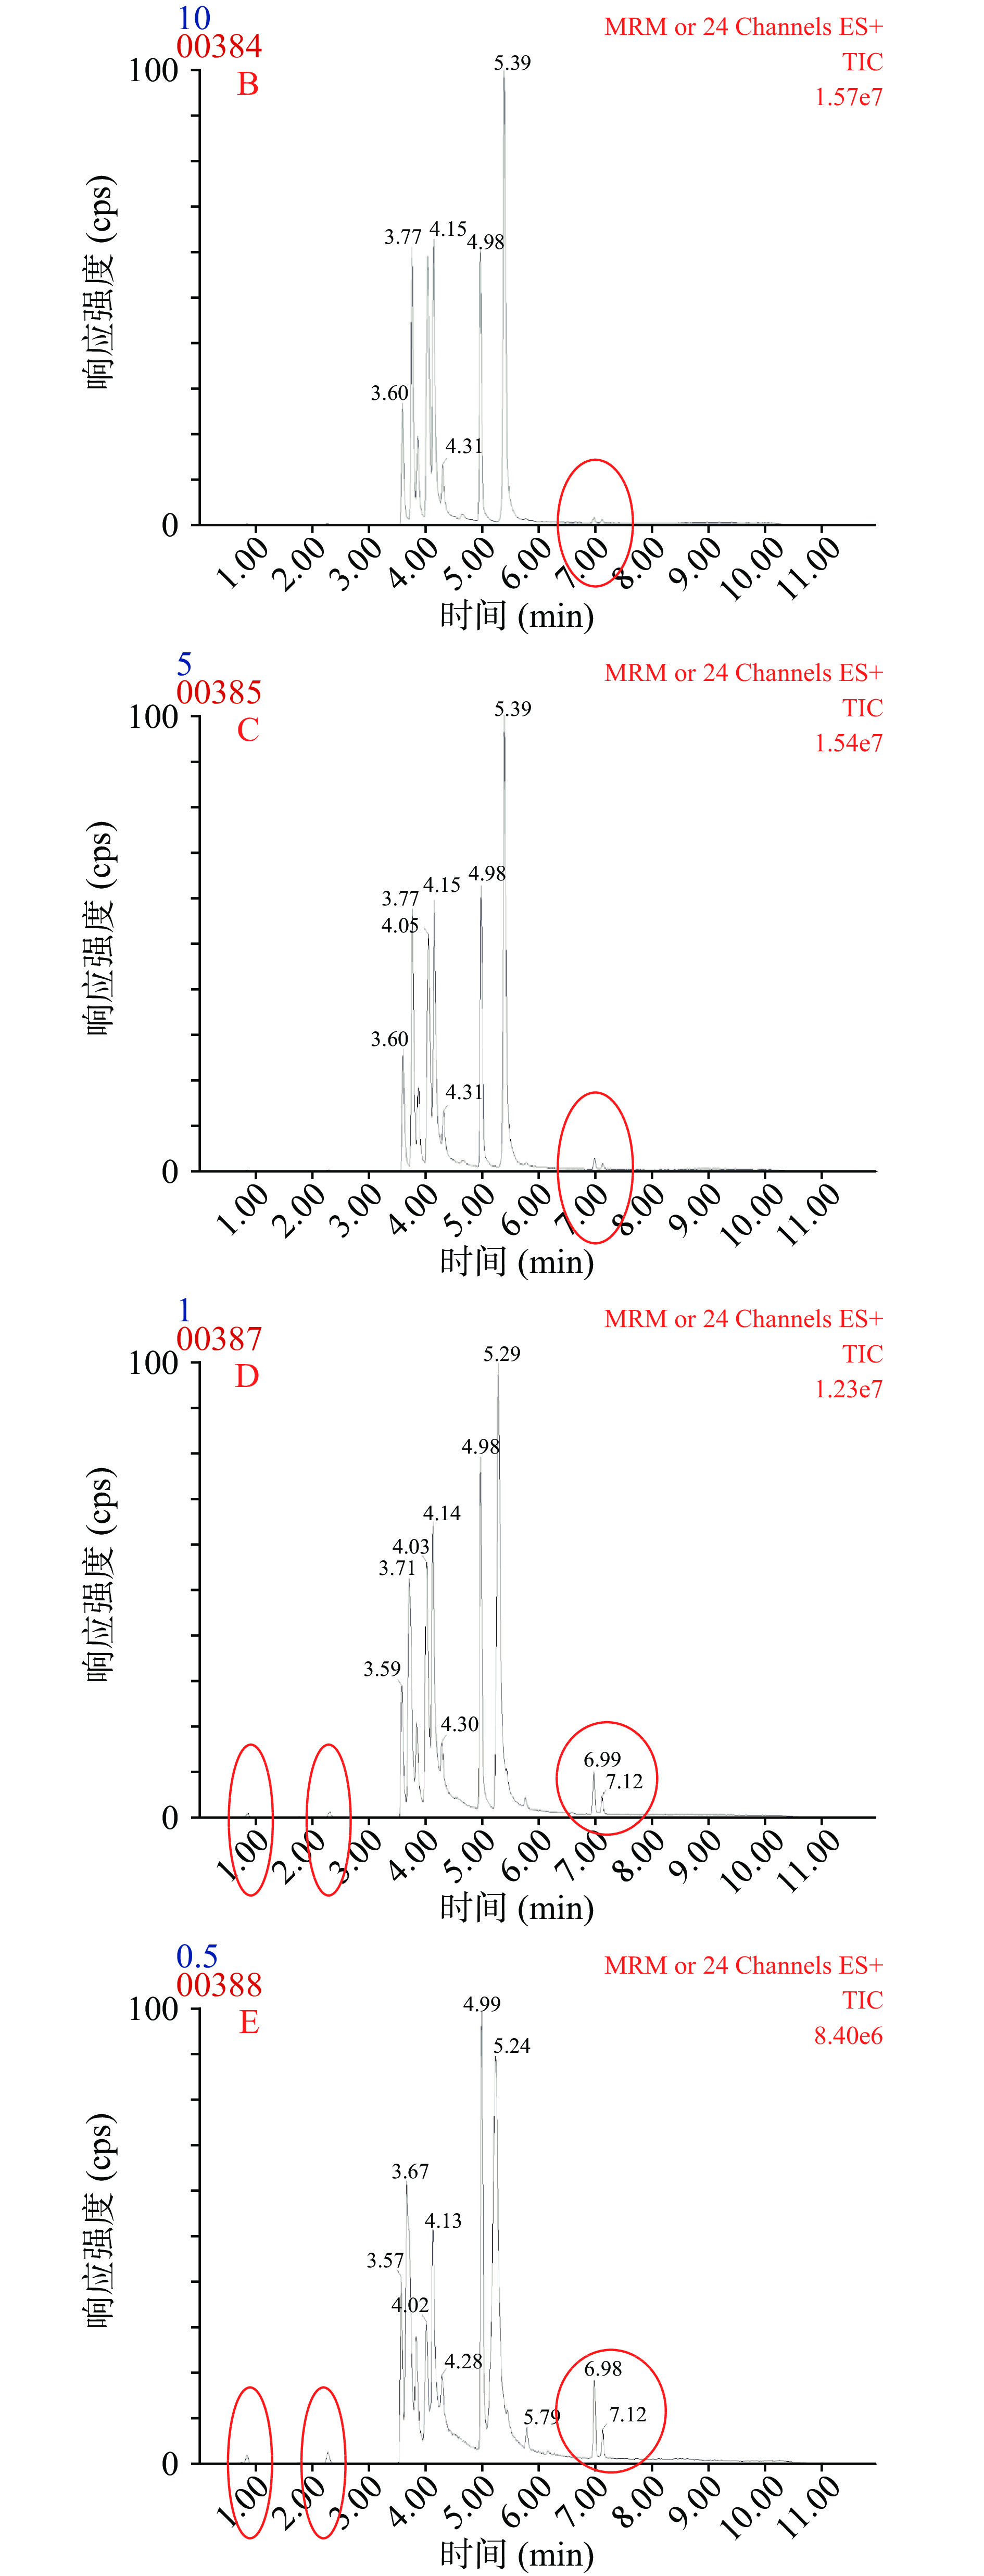
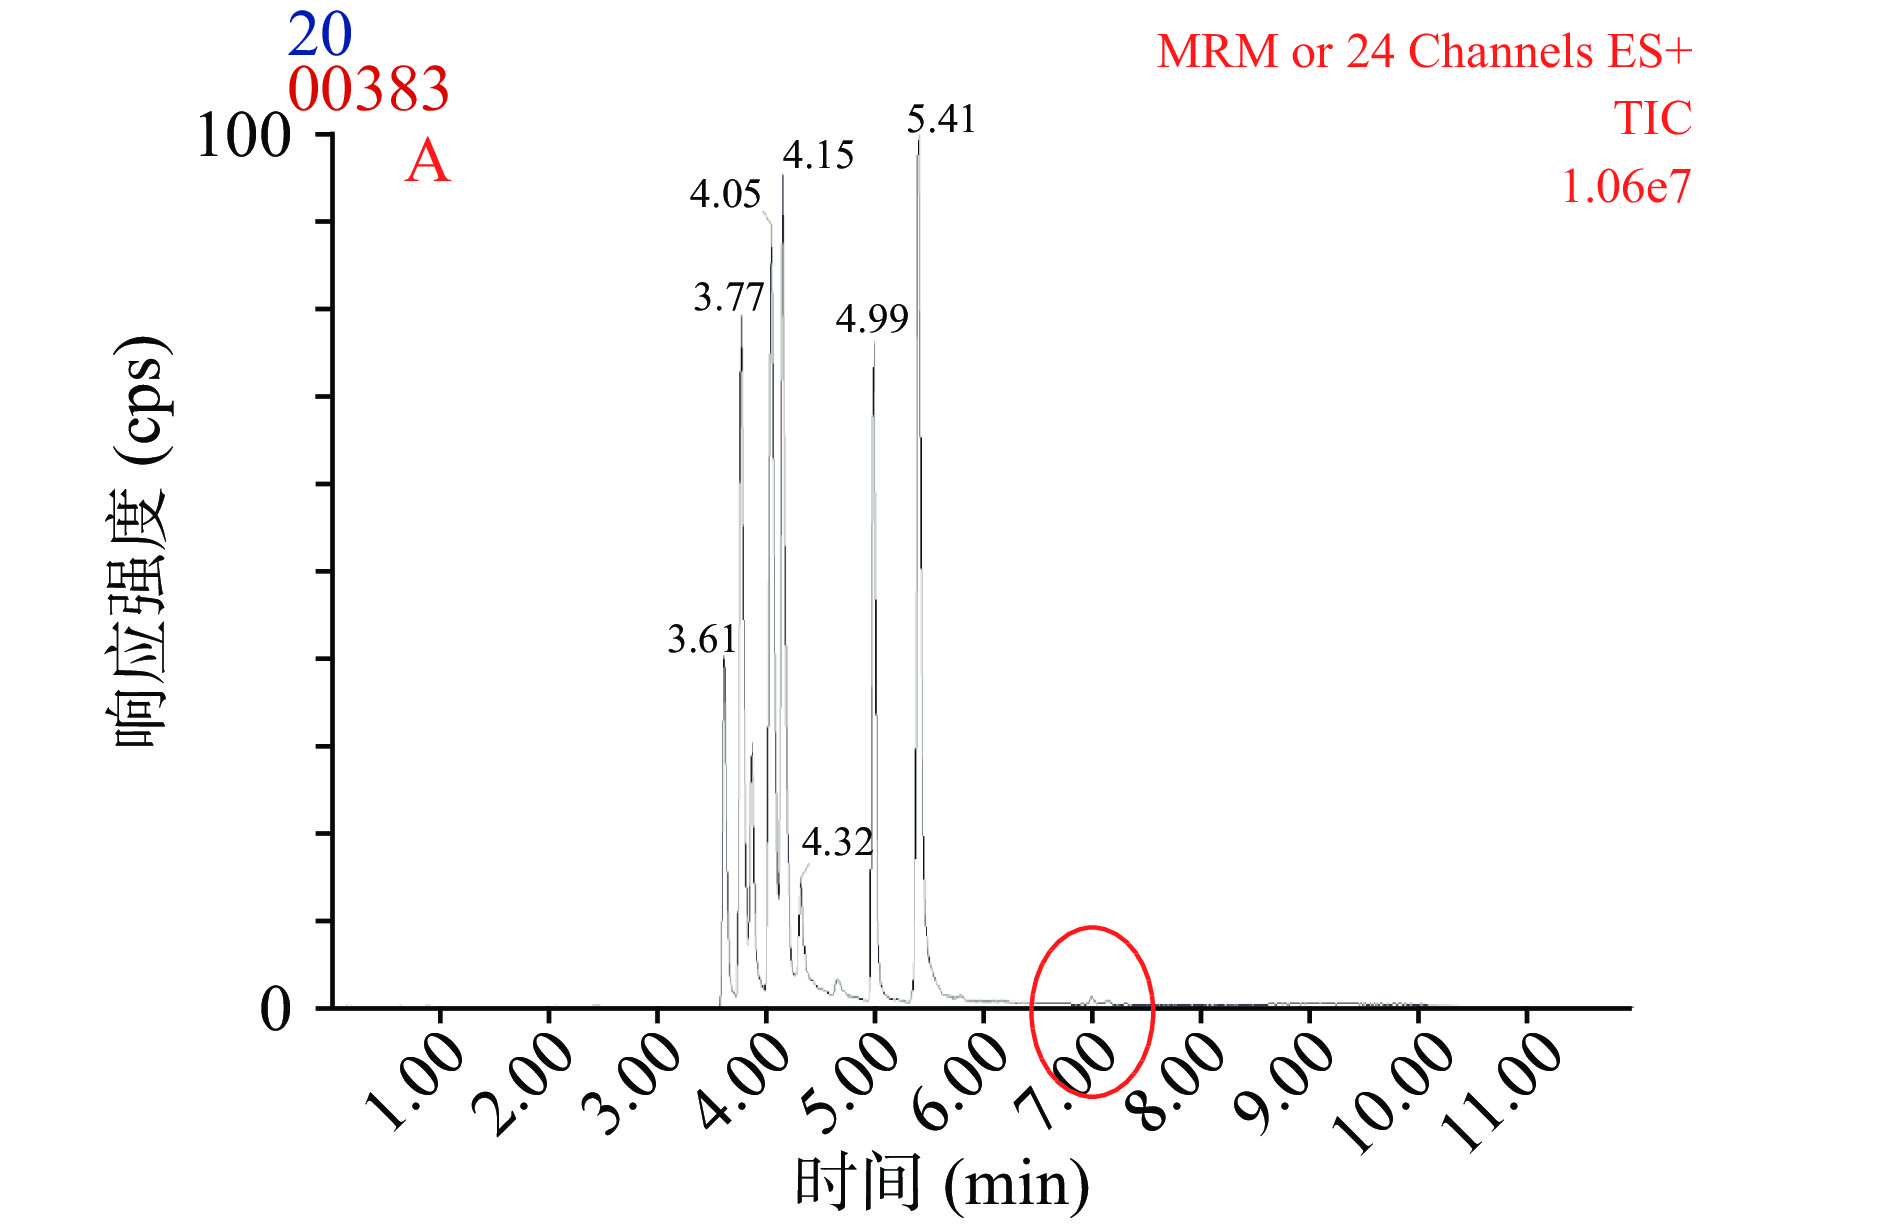
流动相中添加适当的乙酸铵可有效改善AA、NAs和HAAs的峰形,在ESI+模式下乙酸铵的添加与胺类物质的电离抑制呈正相关,因此会影响其响应强度[20-22]。分别以0.5~20 mmol/L五种乙酸铵缓冲溶液为流动相考察对胺类物质响应强度的影响。图1为20~0.5 mmol/L的乙酸铵添加量下20种胺类物质的色谱图。从图中红圈标注部分可看出随着乙酸铵添加量的减少部分胺类物质的响应强度增加。但是,当乙酸铵添加量降到0.5 mmol/L时,峰形有明显的拖尾现象,且20种胺类物质的整体响应强度低于乙酸铵添加量为1 mmol/L的强度,因此选择1 mmol/L乙酸铵作为最后乙酸铵的添加量。
![]() 图 1 流动相中不同乙酸铵添加条件下20种胺类物质的色谱图注:A、B、C、D、E分别为20、10、5、1、0.5 mmol/L。Figure 1. Chromatograms of 20 amines under different ammonium acetate addition conditions in mobile phase
图 1 流动相中不同乙酸铵添加条件下20种胺类物质的色谱图注:A、B、C、D、E分别为20、10、5、1、0.5 mmol/L。Figure 1. Chromatograms of 20 amines under different ammonium acetate addition conditions in mobile phase在ESI+模式下,流动相中少量的甲酸、乙酸会提高化合物的电离效率并有助于其色谱分离[23-25],本文以1 mmol/L的乙酸铵为流动相分析加入0.04%、0.06%、0.1%和0.2%甲酸对20种胺类物的分离效果。结果表明(图略)随着甲酸浓度从0.04%增加到0.2%,胺类化合物迅速解离成离子形式,在C18柱上的保留不断减弱,部分目标物出现保留时间缩短、色谱峰重叠和拖尾等现象。当甲酸添加量为0.04%、0.1%和0.2%时,MeIQx和IQx、NPYR和IQ、TRP-P-1和AaC、MeIQ和DMIP的色谱峰重叠,只有当甲酸添加量为0.06%时MeIQx、IQx、NPYR、DMIP、TRP-P-1、AaC的色谱峰可以有效分离,因此选择0.06%的甲酸加入乙酸铵中。在优化的UHPLC-MS/MS条件下,20种胺类物标准溶液的总离子流色谱图和提取离子流图如图2和图3所示。
![]() 图 2 流动相为1 mmol/L乙酸铵0.06%甲酸条件下20种胺类物质混合标准溶液色谱图Figure 2. Chromatogram of a mixed standard solution of 20 amines with the mobile phase 1 mmol/L ammonium acetate and 0.06% formic acid注:1:AA;2:NPYR;3:DMIP;4:IQ;5:MeIQ;6:IQx;7:MeIQx;8:4,8-DiMeIQx,7,8-DiMeIQx;9:Norharman;10:4,7,8-DiMeIQx;11:Harman;12:NPIP;13:PHIP;14:TRP-P-1,TRP-P-2;15:AaC;16:NDPA;17:NDBA;18:NDPHA。
图 2 流动相为1 mmol/L乙酸铵0.06%甲酸条件下20种胺类物质混合标准溶液色谱图Figure 2. Chromatogram of a mixed standard solution of 20 amines with the mobile phase 1 mmol/L ammonium acetate and 0.06% formic acid注:1:AA;2:NPYR;3:DMIP;4:IQ;5:MeIQ;6:IQx;7:MeIQx;8:4,8-DiMeIQx,7,8-DiMeIQx;9:Norharman;10:4,7,8-DiMeIQx;11:Harman;12:NPIP;13:PHIP;14:TRP-P-1,TRP-P-2;15:AaC;16:NDPA;17:NDBA;18:NDPHA。![]() 图 3 流动相为1mmol/L乙酸铵0.06%甲酸条件下20种胺类物质提取离子流图Figure 3. Ion flow diagram of 20 kinds of amines extracted with the mobile phase 1 mmol/L ammonium acetate and 0.06% formic acid
图 3 流动相为1mmol/L乙酸铵0.06%甲酸条件下20种胺类物质提取离子流图Figure 3. Ion flow diagram of 20 kinds of amines extracted with the mobile phase 1 mmol/L ammonium acetate and 0.06% formic acid2.2 胺类物质提取条件优化
2.2.1 提取溶剂选择
不同化合物间极性差异较大,极性强度范围很广,热加工肉制品基质复杂,且富含油脂。因此,为了同时提取复杂基质体系中的目标化合物,非常需要探究提取溶剂适宜性。因此本研究以空白肉样为基质样品,分析90%乙腈水、乙腈、含0.1%甲酸的乙腈和乙腈/1 mmol/L的NaOH溶液(6/4,v/v)对20种胺类物质回收率的影响。如图4所示,以90%乙腈水、乙腈、含0.1%甲酸的乙腈为提取剂时,部分极性杂环胺和亚硝胺类的回收率低于60%,甚至NDBA和NMOR的回收率低于40%,在同时提取胺类物质时提取效率不稳定。当以乙腈/NaOH溶液(6/4,v/v)为提取剂时,回收率稳定在69.46%~103.13%之间,具有良好的稳定性。
![]() 图 4 20种胺类物质在不同提取剂中的回收率Figure 4. Extraction recoveries of 20 amines in different extractants
图 4 20种胺类物质在不同提取剂中的回收率Figure 4. Extraction recoveries of 20 amines in different extractants2.2.2 纯化条件的优化
PSA和HC-C18是在QuEChERS技术中常用的吸附剂[26]。本研究以不同用量的PSA(20、30、40和50 mg)以及30 mg PSA+30 mg HC-C18分析对胺类物质回收率的影响。如图5所示,随着PSA用量的增加,胺类物质的回收率先降低后增加。当PSA的用量增至50 mg,回收率相对较好。当以30 mg PSA+30 mg HC-C18作为吸附剂时,DMIP、IQX、IQ和MeIQ的吸附率均低于60%,其余胺类物质的回收率降低。总体而言,使用50 mg的PSA作为吸附剂时可以获得良好的提取和纯化效果。
![]() 图 5 20种胺类物质在不同吸附剂中的回收率Figure 5. Extraction recoveries of 20 amines in different adsorbents
图 5 20种胺类物质在不同吸附剂中的回收率Figure 5. Extraction recoveries of 20 amines in different adsorbents2.3 方法验证
2.3.1 线性关系、检出限、定量限和基质效应
基质效应(ME)由空白样品(B)和纯溶剂(A)的斜率之比计算(ME=B/A)。通常,ME<0.8表示基质抑制,而ME>1.2表示基质增强[27-28]。基质效应结果如表2所示,DMIP、IQ和TRP-P-2、NPYR和NDPHA的ME均在0.41~0.79之间,说明它们具有严重的基质抑制作用;IQx、NDPA和NDBA的ME范围为0.80~0.83,具有轻微的基质抑制作用,可以忽略不计;其余目标化合物的ME介于0.93~1.23之间,基本没有基质效应。因此,为了进一步校准定量结果的准确性,采用基质校准曲线对目标化合物进行定量。
表 2 20种目标化合物的标准曲线、检测限、定量限和基质效应Table 2. Standard curves, detection limits, quantification limits and matrix effects of 20 target compounds化合物 线性范围(ng/mL) 校准曲线 R2 LOD(ng/kg) LOQ(ng/kg) ME AA 1~100 y=174.061x+74.1202 0.997 0.75 2.25 0.93 DMIP 0.1~100 y=0.0102x+0.017 0.998 0.1 0.3 0.67 IQx 0.1~100 y=0.009x+0.0064 0.999 0.06 0.18 0.83 IQ 0.1~100 y=0.0069x+0.0172 0.994 0.06 0.18 0.41 MeIQ 0.1~100 y=0.0157x+0.0093 0.991 0.1 0.3 1.17 MeIQx 0.1~100 y=0.0105x+0.0048 0.998 0.02 0.06 1.17 7,8-DiMeIQx 0.1~100 y=0.032x−0.0093 0.996 0.01 0.03 1.09 4,8-DiMeIQx 0.1~100 y=0.0231x−0.0006 0.997 0.02 0.06 0.97 Norharman 0.1~100 y=0.0467x−0.0185 0.999 0.06 0.18 1.15 Harman 0.1~100 y=0.9079x−0.9526 0.998 0.02 0.06 1.17 TRP-P-2 1~100 y=0.0059x−0.0548 0.995 0.75 2.25 0.47 PhIP 0.1~100 y=0.4951x−0.4404 0.994 0.01 0.03 1.15 TRP-P-1 0.1~100 y=0.0448x−0.07 0.997 0.01 0.03 1.23 AaC 0.5~100 y=0.0127x+0.0015 0.996 0.4 1.2 0.95 NPYR 2~100 y=565.381x−62.9893 0.995 1.5 4.5 0.63 NDPA 1~100 y=272.29x−6.82813 0.997 0.8 2.4 0.80 NDPHA 0.1~100 y=187.967x+280.38 0.999 0.06 0.18 0.79 NDBA 0.1~100 y=666.164x+440.269 0.997 0.01 0.03 0.80 NMOR 2~100 y=41.4562x−23.3852 0.996 1.6 4.8 1.01 NPIP 0.5~100 y=436.673x−552.953 0.998 0.5 1.5 1.10 胺类物质的线性标准曲线和相关系数如表2所示,溶剂校准曲线在其相应的浓度范围内呈线性,所有研究的AA、NAs和HAAs的测定系数均大于0.991。检测限(LOD)和定量限(LOQ)分别以产生信噪比的浓度(S/N)为3和10表示[29-30]。20种胺类物质的LOD和LOQ范围分别为0.01~1.6 ng/g和0.03~4.8 ng/g,可以满足实际样品的定量检测。
2.3.2 回收率和精密度测试
通过3个不同浓度(1×、5×和10×LOQ)下添加6个重复样品来估算回收率。准确度表示为测量浓度和加标浓度之间的差异。精密度表示为相对标准偏差(RSD,%)[31]。从表3和表4可见,日内回收率在66.3%~116.5%之间,3个加标水平下回收率的平均值在70.2%~110.1%范围内。日内精密度在0.78%~9.0%之间,3个加标水平精密度的平均值在3.8%~7.3%范围内。5×LOQ加标水平计算的日间精度范围为3.4%~9.4%。结果表明这种特定类型脂肪基质的样品制备方法具有良好的可重复性,方法回收率高,准确度和精密度良好。整个方法具有良好的稳定性,可用于实际样品的检测。
表 3 20种胺类物质的加标回收率Table 3. Standard recovery rates of 20 amines化合物 本底量
(ng/g)添加量
(ng/g)回收率(%) 1×LOQ 5×LOQ 10×LOQ AA 3 3.0、15.0、30.0 89.4±3.7 96.4±6.4 97.8±7.8 DMIP ND 0.3、1.5、3.0 89.1±4.9 92.3±4.3 94.4±5.5 IQx ND 0.2、1.0、2.0 86.2±5.8 84.2±6.4 90.5±7.2 IQ ND 0.2、1.0、2.0 71.2±2.9 83.1±5.9 77.8±4.5 MeIQ ND 0.3、1.5、3.0 111.5±9.2 103.5±7.3 115.2±7.0 MeIQx ND 0.1、0.5、1.0 87.2±6.7 82.7±5.7 81.5±4.8 7,8-DiMeIQx ND 0.1、0.5、1.0 90.4±3.0 92.5±3.9 83.7±4.4 4,8-DiMeIQx ND 0.1、0.5、1.0 96.6±4.5 99.1±6.8 95.1±5.9 Norharman 1.7 0.2、1.0、2.0 116.5±3.6 104.3±4.0 104.6±6.1 Harman 1.4 0.1、0.5、1.0 88.0±4.6 82.9±5.3 90.0±3.8 TRP-P-2 ND 3.0、15.0、30.0 66.3±2.9 71.4±3.4 72.9±4.1 PHIP ND 0.1、0.5、1.0 96.3±5.8 110.3±6.7 109.3±8.5 TRP-P-1 ND 0.1、0.5、1.0 97.1±3.5 105.1±8.4 100.8±2.1 AaC ND 1.0、5.0、10.0 98.5±9.5 90.2±8.3 107.3±8.8 NPYR ND 5.0、25.0、50.0 81.2±5.2 77.8±6.4 74.7±5.7 NDPA ND 3.0、15.0、30.0 109.4±7.6 96.4±6.4 97.9±7.8 NDPHA ND 0.2、1.0、2.0 85.7±7.1 97.7±4.7 96.3±5.9 NDBA ND 0.1、0.5、1.0 81.7±4.3 82.7±8.2 88.5±5.1 NMOR ND 5.0、25.0、50.0 86.4±4.7 80.1±5.6 77.3±3.6 NPIP ND 2.0、10.0、20.0 86.3±3.1 92.3±7.0 86.3±5.5 注:ND表示未检出;表4同。 表 4 20种胺类物质的精密度Table 4. Precisions of 20 amines化合物 本底量
(ng/g)日间精密度
(%)日内精密度(%,n=6) 1×LOQ 5×LOQ 10×LOQ AA 3 4.3±2.5 6.1±2.1 5.8±0.4 6.5±1.1 DMIP ND 6.9±2.6 5.7±0.8 3.3±1.1 7.8±1.3 IQx ND 8.0±2.4 5.1±0.8 5.5±1.3 7.7±1.5 IQ ND 8.9±1.8 7.3±1.6 7.2±3.0 3.1±0.7 MeIQ ND 7.0±2.1 5.9±1.7 7.8±1.3 6.4±2.6 MeIQx ND 5.2±2.1 4.8±2.5 5.9±1.1 7.1±1.3 7,8-DiMeIQx ND 5.4±2.3 5.4±1.6 2.9±1.2 4.0±0.7 4,8-DiMeIQx ND 3.4±0.2 5.1±1.5 5.2±1.5 5.5±1.6 Norharman 1.7 7.1±3.1 5.2±1.1 7.8±3.5 5.9±2.5 Harman 1.4 7.9±1.1 4.5±1.1 0.78±0.4 6.2±1.2 TRP-P-2 ND 5.8±2.9 6.6±1.3 6.2±1.9 8.1±1.6 PHIP ND 7.0±2.4 6.7±2.2 5.3±1.6 5.3±1.3 TRP-P-1 ND 8.5±2.4 8.2±3.3 4.1±0.8 3.9±1.6 AaC ND 6.9±3.1 8.3±3.2 6.9±2.8 6.8±1.4 NPYR ND 6.6±1.8 8.8±1.4 7.8±3.3 3.9±0.6 NDPA ND 8.7±2.0 4.1±1.1 3.8±0.7 5.3±1.2 NDPHA ND 9.4±2.6 5.3±1.5 7.2±2.9 3.8±0.8 NDBA ND 5.4±2.3 9.0±2.1 4.3±1.5 6.6±1.6 NMOR ND 6.1±1.9 6.9±1.5 6.9±2.3 8.1±1.5 NPIP ND 8.1±1.7 6.2±1.1 5.1±1.5 5.7±1.4 2.4 煎烤产品的检测分析
采用本研究建立的方法测定3、5、7 min下煎烤的四种肉制品,共检测出9种胺类物质,见表5,包括AA,三种亚硝胺(NDPHA、NDBA和NPIP),三种极性杂环胺(4,8-DiMeIQx、7,8-DiMeIQx和PHIP)和两种非极性杂环胺(Norharman和Harman),其他的胺类物质未检出。在相同的加热时间下,不同肉制品之间形成的胺类物质含量差异显著(P<0.05)。这三个温度的设定,考虑分别界定煎烤模式下的微熟、熟和焦熟三种状态,但是由于四种肉的成熟条件有一定差异,又难以通过区别加热来衡量,因此在保证全部熟制条件下统一为如上三个时间。
表 5 煎烤3、5、7 min四种肉品中胺类物质的含量Table 5. Amines contents in four types of meat products at grilling for 3, 5, and 7 minutes有害物种类 加工时间(min) 肉制品胺类物质含量(ng/g) 牛肉 鸡肉 猪肉 羊肉 NDPHA 3 9.06±0.01a 2.53±0.41b − 1.29±0.10c 5 11.47±0.76a 5.53±1.46b − 1.09±0.13c 7 11.83±0.25a 6.56±0.11b − 1.28±0.34c 4,8-DiMeIQx 3 0.07±0.01d 0.26±0.04a 0.20±0.01b 0.13±0.02c 5 0.29±0.04b 0.28±0.04b 0.58±0.22a 0.11±0.01c 7 0.22±0.07c 0.40±0.02b 1.44±0.24a 0.22±0.08c 7,8-DiMeIQx 3 0.03±0.02c 0.17±0.05a 0.13±0.06b 0.16±0.05a 5 0.22±0.11c 0.25±0.10b 0.99±0.07a 0.12±0.06d 7 0.46±0.19b 0.30±0.12d 1.76±0.08a 0.41±0.05c PHIP 3 − 0.08±0.02a 0.06±0.02b − 5 − 0.14±0.03b 0.68±0.36a − 7 − 0.14±0.02b 1.89±0.39a 0.14±0.02b Norharman 3 15.48±2.68a 6.68±0.40b 6.48±1.00c 5.37±0.44d 5 17.80±6.89a 5.45±0.23d 7.59±2.95c 9.07±0.68b 7 22.69±2.02a 7.69±0.84d 8.75±1.24c 15.18±3.96b Harman 3 3.21±0.19a 1.69±0.06c 1.53±0.20d 2.16±0.02b 5 3.28±1.44b 1.79±0.07d 3.19±1.20c 9.74±0.11a 7 4.53±0.33b 2.07±0.09d 3.12±0.21c 10.22±0.31a NDBA 3 0.08±0.02c 0.13±0.01b 0.15±0.02a 0.09±0.01c 5 0.13±0.01d 0.15±0.07c 0.17±0.02b 0.19±0.06a 7 0.16±0.03c 0.23±0.02b 0.23±0.03b 0.25±0.05a NPIP 3 18.41±3.06a 8.24±0.78b 6.45±0.78c 4.96±0.95d 5 28.89±1.57a 13.03±0.10b 11.95±0.49c 6.89±1.02d 7 31.26±1.79a 14.27±1.01b 13.45±1.59c 7.78±1.15d AA 3 11.90±3.29b 5.61±3.75d 8.37±0.77c 12.58±2.94a 5 19.20±6.42a 18.58±3.81b 14.64±2.09c 10.38±0.77d 7 28.31±2.96a 18.83±3.27c 22.60±1.74b 18.20±4.08d 注:−表示未检出;同行不同字母表示差异显著(P<0.05)。 目前,国内未出台肉制品中AA、NAs和HAAs的限量标准,但从表5可见,随着煎烤时间的延长,每种肉制品中胺类物质含量均呈逐渐增加趋势。因此,在日常的煎烤肉制品过程中,在保证肉成熟的情况下避免煎烤时间过长,避免对人体健康造成危害。
3. 结论
本文通过对色谱柱、流动相、盐析条件、提取剂、吸附剂等进行优化,建立了QuEChERS技术结合UHPLC-MS/MS同时检测分析肉制品中三种胺类物含量的方法。方法的线性范围在0.991~0.999之间,检测限和定量限分别在0.01~1.6 ng/g和0.03~4.8 ng/g,日内平均回收率介于70.2%~110.1%之间。利用该方法测定煎烤肉品中胺类物质含量在0.03~31.26 ng/g。该方法实现了对三种胺成分的同时检测,改善了传统方法时间长、复杂、消耗溶剂量大的不足,能够对含脂肪基质原料(如猪肉、牛肉等)进行有效的胺类成分检测,适用于快速分析肉制品中的胺类成分。
-
![]()
图 1 流动相中不同乙酸铵添加条件下20种胺类物质的色谱图
注:A、B、C、D、E分别为20、10、5、1、0.5 mmol/L。
Figure 1. Chromatograms of 20 amines under different ammonium acetate addition conditions in mobile phase
![]()
图 2 流动相为1 mmol/L乙酸铵0.06%甲酸条件下20种胺类物质混合标准溶液色谱图
Figure 2. Chromatogram of a mixed standard solution of 20 amines with the mobile phase 1 mmol/L ammonium acetate and 0.06% formic acid
注:1:AA;2:NPYR;3:DMIP;4:IQ;5:MeIQ;6:IQx;7:MeIQx;8:4,8-DiMeIQx,7,8-DiMeIQx;9:Norharman;10:4,7,8-DiMeIQx;11:Harman;12:NPIP;13:PHIP;14:TRP-P-1,TRP-P-2;15:AaC;16:NDPA;17:NDBA;18:NDPHA。
![]()
图 3 流动相为1mmol/L乙酸铵0.06%甲酸条件下20种胺类物质提取离子流图
Figure 3. Ion flow diagram of 20 kinds of amines extracted with the mobile phase 1 mmol/L ammonium acetate and 0.06% formic acid
![]()
图 4 20种胺类物质在不同提取剂中的回收率
Figure 4. Extraction recoveries of 20 amines in different extractants
![]()
图 5 20种胺类物质在不同吸附剂中的回收率
Figure 5. Extraction recoveries of 20 amines in different adsorbents
表 1 AA、NAs、HAAs的质谱条件
Table 1 MS conditions of AA, NAs and HAAs
化合物 保留时间(min) 锥孔电压(V) MRM离子对(m/z) 碰撞电压(V) AA 0.84 35 72.13/55.27*
72.13/43.9310
10DMIP 2.34 48 162.96/148.05*
162.96/105.20322
32IQx 3.02 58 199.98/185.08*
199.98/131.1226
38IQ 2.51 56 198.90/184.07
198.90/130.0028
40MeIQ 2.86 52 212.97/198.01*
212.97/116.8724
50MeIQx 3.38 54 213.97/130.97*
213.97/199.0238
267,8-DiMeIQx 3.65 60 228.00/213.06*
228.00/131.0326
384,8-DiMeIQx 3.65 54 227.94/212.94*
227.94/144.8322
38Norharman 3.76 60 168.95/141.99*
168.95/89.0126
42Harman 3.93 58 182.90/114.97*
182.90/167.9432
26TRP-P-2 4.13 56 197.97/127.59*
197.97/77.0928
48PHIP 4.15 58 224.97/210.03*
224.97/114.7128
48TRP-P-1 4.28 56 211.98/179.19*
211.98/115.0438
44AaC 4.42 46 183.91/157.003*
183.91/88.9520
46NPYR 2.22 4 100.85/55.12*
100.85/40.0025
15NDPA 5.77 24 130.97/89.08*
130.97/42.858
13NDPHA 7.12 28 199.09/169.10*
199.09/74.1010
12NDBA 6.98 28 158.97/102.99*
158.97/56.9510
13NMOR 1.72 30 117/45*
117/8718
18NPIP 4.07 30 115/41*
115/6916
124,7,8-TriMeIQx 3.87 54 241.87/145.01 40 Norharman-d7 3.73 62 176.03/120.37 30 注:*为定量离子。  下载: 导出CSV
表 2 20种目标化合物的标准曲线、检测限、定量限和基质效应
Table 2 Standard curves, detection limits, quantification limits and matrix effects of 20 target compounds
化合物 线性范围(ng/mL) 校准曲线 R2 LOD(ng/kg) LOQ(ng/kg) ME AA 1~100 y=174.061x+74.1202 0.997 0.75 2.25 0.93 DMIP 0.1~100 y=0.0102x+0.017 0.998 0.1 0.3 0.67 IQx 0.1~100 y=0.009x+0.0064 0.999 0.06 0.18 0.83 IQ 0.1~100 y=0.0069x+0.0172 0.994 0.06 0.18 0.41 MeIQ 0.1~100 y=0.0157x+0.0093 0.991 0.1 0.3 1.17 MeIQx 0.1~100 y=0.0105x+0.0048 0.998 0.02 0.06 1.17 7,8-DiMeIQx 0.1~100 y=0.032x−0.0093 0.996 0.01 0.03 1.09 4,8-DiMeIQx 0.1~100 y=0.0231x−0.0006 0.997 0.02 0.06 0.97 Norharman 0.1~100 y=0.0467x−0.0185 0.999 0.06 0.18 1.15 Harman 0.1~100 y=0.9079x−0.9526 0.998 0.02 0.06 1.17 TRP-P-2 1~100 y=0.0059x−0.0548 0.995 0.75 2.25 0.47 PhIP 0.1~100 y=0.4951x−0.4404 0.994 0.01 0.03 1.15 TRP-P-1 0.1~100 y=0.0448x−0.07 0.997 0.01 0.03 1.23 AaC 0.5~100 y=0.0127x+0.0015 0.996 0.4 1.2 0.95 NPYR 2~100 y=565.381x−62.9893 0.995 1.5 4.5 0.63 NDPA 1~100 y=272.29x−6.82813 0.997 0.8 2.4 0.80 NDPHA 0.1~100 y=187.967x+280.38 0.999 0.06 0.18 0.79 NDBA 0.1~100 y=666.164x+440.269 0.997 0.01 0.03 0.80 NMOR 2~100 y=41.4562x−23.3852 0.996 1.6 4.8 1.01 NPIP 0.5~100 y=436.673x−552.953 0.998 0.5 1.5 1.10
下载: 导出CSV
表 3 20种胺类物质的加标回收率
Table 3 Standard recovery rates of 20 amines
化合物 本底量
(ng/g)添加量
(ng/g)回收率(%) 1×LOQ 5×LOQ 10×LOQ AA 3 3.0、15.0、30.0 89.4±3.7 96.4±6.4 97.8±7.8 DMIP ND 0.3、1.5、3.0 89.1±4.9 92.3±4.3 94.4±5.5 IQx ND 0.2、1.0、2.0 86.2±5.8 84.2±6.4 90.5±7.2 IQ ND 0.2、1.0、2.0 71.2±2.9 83.1±5.9 77.8±4.5 MeIQ ND 0.3、1.5、3.0 111.5±9.2 103.5±7.3 115.2±7.0 MeIQx ND 0.1、0.5、1.0 87.2±6.7 82.7±5.7 81.5±4.8 7,8-DiMeIQx ND 0.1、0.5、1.0 90.4±3.0 92.5±3.9 83.7±4.4 4,8-DiMeIQx ND 0.1、0.5、1.0 96.6±4.5 99.1±6.8 95.1±5.9 Norharman 1.7 0.2、1.0、2.0 116.5±3.6 104.3±4.0 104.6±6.1 Harman 1.4 0.1、0.5、1.0 88.0±4.6 82.9±5.3 90.0±3.8 TRP-P-2 ND 3.0、15.0、30.0 66.3±2.9 71.4±3.4 72.9±4.1 PHIP ND 0.1、0.5、1.0 96.3±5.8 110.3±6.7 109.3±8.5 TRP-P-1 ND 0.1、0.5、1.0 97.1±3.5 105.1±8.4 100.8±2.1 AaC ND 1.0、5.0、10.0 98.5±9.5 90.2±8.3 107.3±8.8 NPYR ND 5.0、25.0、50.0 81.2±5.2 77.8±6.4 74.7±5.7 NDPA ND 3.0、15.0、30.0 109.4±7.6 96.4±6.4 97.9±7.8 NDPHA ND 0.2、1.0、2.0 85.7±7.1 97.7±4.7 96.3±5.9 NDBA ND 0.1、0.5、1.0 81.7±4.3 82.7±8.2 88.5±5.1 NMOR ND 5.0、25.0、50.0 86.4±4.7 80.1±5.6 77.3±3.6 NPIP ND 2.0、10.0、20.0 86.3±3.1 92.3±7.0 86.3±5.5 注:ND表示未检出;表4同。
下载: 导出CSV
表 4 20种胺类物质的精密度
Table 4 Precisions of 20 amines
化合物 本底量
(ng/g)日间精密度
(%)日内精密度(%,n=6) 1×LOQ 5×LOQ 10×LOQ AA 3 4.3±2.5 6.1±2.1 5.8±0.4 6.5±1.1 DMIP ND 6.9±2.6 5.7±0.8 3.3±1.1 7.8±1.3 IQx ND 8.0±2.4 5.1±0.8 5.5±1.3 7.7±1.5 IQ ND 8.9±1.8 7.3±1.6 7.2±3.0 3.1±0.7 MeIQ ND 7.0±2.1 5.9±1.7 7.8±1.3 6.4±2.6 MeIQx ND 5.2±2.1 4.8±2.5 5.9±1.1 7.1±1.3 7,8-DiMeIQx ND 5.4±2.3 5.4±1.6 2.9±1.2 4.0±0.7 4,8-DiMeIQx ND 3.4±0.2 5.1±1.5 5.2±1.5 5.5±1.6 Norharman 1.7 7.1±3.1 5.2±1.1 7.8±3.5 5.9±2.5 Harman 1.4 7.9±1.1 4.5±1.1 0.78±0.4 6.2±1.2 TRP-P-2 ND 5.8±2.9 6.6±1.3 6.2±1.9 8.1±1.6 PHIP ND 7.0±2.4 6.7±2.2 5.3±1.6 5.3±1.3 TRP-P-1 ND 8.5±2.4 8.2±3.3 4.1±0.8 3.9±1.6 AaC ND 6.9±3.1 8.3±3.2 6.9±2.8 6.8±1.4 NPYR ND 6.6±1.8 8.8±1.4 7.8±3.3 3.9±0.6 NDPA ND 8.7±2.0 4.1±1.1 3.8±0.7 5.3±1.2 NDPHA ND 9.4±2.6 5.3±1.5 7.2±2.9 3.8±0.8 NDBA ND 5.4±2.3 9.0±2.1 4.3±1.5 6.6±1.6 NMOR ND 6.1±1.9 6.9±1.5 6.9±2.3 8.1±1.5 NPIP ND 8.1±1.7 6.2±1.1 5.1±1.5 5.7±1.4
下载: 导出CSV
表 5 煎烤3、5、7 min四种肉品中胺类物质的含量
Table 5 Amines contents in four types of meat products at grilling for 3, 5, and 7 minutes
有害物种类 加工时间(min) 肉制品胺类物质含量(ng/g) 牛肉 鸡肉 猪肉 羊肉 NDPHA 3 9.06±0.01a 2.53±0.41b − 1.29±0.10c 5 11.47±0.76a 5.53±1.46b − 1.09±0.13c 7 11.83±0.25a 6.56±0.11b − 1.28±0.34c 4,8-DiMeIQx 3 0.07±0.01d 0.26±0.04a 0.20±0.01b 0.13±0.02c 5 0.29±0.04b 0.28±0.04b 0.58±0.22a 0.11±0.01c 7 0.22±0.07c 0.40±0.02b 1.44±0.24a 0.22±0.08c 7,8-DiMeIQx 3 0.03±0.02c 0.17±0.05a 0.13±0.06b 0.16±0.05a 5 0.22±0.11c 0.25±0.10b 0.99±0.07a 0.12±0.06d 7 0.46±0.19b 0.30±0.12d 1.76±0.08a 0.41±0.05c PHIP 3 − 0.08±0.02a 0.06±0.02b − 5 − 0.14±0.03b 0.68±0.36a − 7 − 0.14±0.02b 1.89±0.39a 0.14±0.02b Norharman 3 15.48±2.68a 6.68±0.40b 6.48±1.00c 5.37±0.44d 5 17.80±6.89a 5.45±0.23d 7.59±2.95c 9.07±0.68b 7 22.69±2.02a 7.69±0.84d 8.75±1.24c 15.18±3.96b Harman 3 3.21±0.19a 1.69±0.06c 1.53±0.20d 2.16±0.02b 5 3.28±1.44b 1.79±0.07d 3.19±1.20c 9.74±0.11a 7 4.53±0.33b 2.07±0.09d 3.12±0.21c 10.22±0.31a NDBA 3 0.08±0.02c 0.13±0.01b 0.15±0.02a 0.09±0.01c 5 0.13±0.01d 0.15±0.07c 0.17±0.02b 0.19±0.06a 7 0.16±0.03c 0.23±0.02b 0.23±0.03b 0.25±0.05a NPIP 3 18.41±3.06a 8.24±0.78b 6.45±0.78c 4.96±0.95d 5 28.89±1.57a 13.03±0.10b 11.95±0.49c 6.89±1.02d 7 31.26±1.79a 14.27±1.01b 13.45±1.59c 7.78±1.15d AA 3 11.90±3.29b 5.61±3.75d 8.37±0.77c 12.58±2.94a 5 19.20±6.42a 18.58±3.81b 14.64±2.09c 10.38±0.77d 7 28.31±2.96a 18.83±3.27c 22.60±1.74b 18.20±4.08d 注:−表示未检出;同行不同字母表示差异显著(P<0.05)。
下载: 导出CSV
-
[1] LUND M N, RAY C A. Control of Maillard reactions in foods: Strategies and chemical mechanisms[J]. Journal of Agricultural and Food Chemistry,2017,65(23):4537−4552. doi: 10.1021/acs.jafc.7b00882
[2] OZ F, KABAN G, KAYA M. Effects of cooking methods and levels on formation of heterocyclic aromatic amines in chicken and fish with oasis extraction method[J]. LWT-Food Science and Technology,2010,43(9):1345−1350. doi: 10.1016/j.lwt.2010.04.014
[3] 杨旭卉, 黄运安, 关天琪, 等. 红肉及其加工制品的营养价值及癌症风险控制的研究进展[J]. 现代食品,2021(8):33−37. [YANG X H, HUANG Y A, GUAN T Q, et al. Research progress on nutritional value and cancer risk control of red meat and its processed products[J]. Modern Food,2021(8):33−37. doi: 10.16736/j.cnki.cn41-1434/ts.2021.08.011 YANG X H, HUANG Y A, GUAN T Q, et al. Research progress on nutritional value and cancer risk control of red meat and its processed products[J]. Modern Food, 2021(8): 33-37. doi: 10.16736/j.cnki.cn41-1434/ts.2021.08.011
[4] 杨光, 李博, 李岳桦. QuEChERS-气相色谱-串联质谱法测定香肠和火腿肠制品中13种N-亚硝胺化合物[J]. 食品安全质量检测学报,2019,10(24):8436−8443. [YANG G, LI B, LI Y H. Determination of 13 N-nitrosamines in sausage and ham products by QuEChERS-gas chromatography-tandem mass spectrometry[J]. Journal of Food Safety and Quality,2019,10(24):8436−8443. doi: 10.19812/j.cnki.jfsq11-5956/ts.2019.24.041 YANG G, LI B, LI Y H. Determination of 13 N-nitrosamines in sausage and ham products by QuEChERS-gas chromatography-tandem mass spectrometry[J]. Journal of Food Safety and Quality, 2019, 10(24): 8436-8443. doi: 10.19812/j.cnki.jfsq11-5956/ts.2019.24.041
[5] DUDA-CHODAK A, TARKO T, SROKA P, et al. A review of the interactions between acrylamide, microorganisms and food components[J]. Food Function,2016,3:1282−1295.
[6] BIESALSKI H K. Meat as a component of a healthy diet-are there any risks or benefits if meat is avoided in the diet[J]. Meat Science,2005,70(3):509−524. doi: 10.1016/j.meatsci.2004.07.017
[7] OZ F, KABAN G, KAYA M. Effects of cooking methods on the formation of heterocyclic aromatic amines of two different species of trout[J]. Food Chemistry,2007,10:67−72.
[8] MAAN A A, ANJUM M A, KASHIF M, et al. Acrylamide formation and different mitigation strategies during food processing-A review[J]. Food Reviews International,2022,38:78−80.
[9] MOLLAKHALILI-MEYBODI N, KHORSHIDIAN N, NEMATOLLAHI A, et al. Acrylamide in bread: A review on formation, health risk assessment, and determination by analytical techniques[J]. Environmental Science and Pollution Research,2021,28(13):15627−15645. doi: 10.1007/s11356-021-12775-3
[10] QIN L, ZHANG Y Y, XU X B, et al. Isotope dilution HPLC-MS/MS for simultaneous quantification of acrylamideand 5-hydroxymethylfurfural (HMF) in thermally processed seafood[J]. Food Chemistry,2017,232:633−638. doi: 10.1016/j.foodchem.2017.04.069
[11] JAMALI M A, ZHANG Y W, TENG H, et al. Inhibitory effectof Rosa rugosa tea extract on the formation of heterocyclic amines in meat patties at different temperatures[J]. Molecules,2016,21:173−187. doi: 10.3390/molecules21020173
[12] SUN S Y, YUN F, YONG M X. A facile detection of acrylamide in starchy food by using a solid extraction-GC strategy[J]. Food Control,2012,26(2):220−222. doi: 10.1016/j.foodcont.2012.01.028
[13] ZOKAEI M, ABEDI A, KAMANKESH M, et al. Ultrasonic-assisted extraction and dispersive liquid-liquid microextraction combined with gas chromatography-mass spectrometry as an efficient and sensitive method for determining of acrylamide in potato chips samples[J]. Food Chemistry,2017,234:55−61. doi: 10.1016/j.foodchem.2017.04.141
[14] AEENEHVAND S, TOUDEHROUSTA Z, KAMANKESH M. Evaluation and application of microwave-assisted extraction and dispersive liquid-liquid microextraction followed by high-performance liquid chromatography for the determination of polar heterocyclic aromatic amines in hamburger patties[J]. Food Chemistry,2016,190:429−435. doi: 10.1016/j.foodchem.2015.05.103
[15] AMAYREH M, CHANBASHA B, ALHOOSHANI K, et al. Determination of N-nitrosamines by automated dispersive liquid-liquid microextraction integrated with gas chromatography and mass spectrometry[J]. Journal of Separation Science,2015,38(10):1741−1748. doi: 10.1002/jssc.201401043
[16] IAMMARINO M, MICHELE M, CHIARAVALLE A E. Anion exchange polymeric sorbent coupled to high-performance liquid chromatography with UV diode array detection for the determination of ten N-nitrosamines in meat products: A validated approach[J]. International Journal of Food Science and Technology,2019,55(3):1097−1109.
[17] BORTOLOMEAZZI R, ANESE M, VERARDO G, et al. Rapid mixed mode solid phase extraction method for the determination of acrylamide in roasted coffee by HPLC-MS/MS[J]. Food Chemistry,2012,135(4):2687−2693. doi: 10.1016/j.foodchem.2012.07.057
[18] NI W, MCNAUGHTON L, LEMASTER D M, et al. Quantitation of 13 heterocyclic aromatic amines in cooked beef, pork, and chicken by liquid chromatography-electrospray ionization/tandem mass spectrometry[J]. Journal of Agricultural and Food Chemistry,2008,56(1):68−78. doi: 10.1021/jf072461a
[19] DONG H, XIAN Y, XIAO K, et al. Development and comparison of single-step solid phase extraction and QuEChERS clean-up for the analysisof 7 mycotoxins in fruits and vegetables during storage by UHPLC-MS/MS[J]. Food Chemistry,2019,274:471−479. doi: 10.1016/j.foodchem.2018.09.035
[20] 张甜. 肉制品中N-亚硝胺检测的前处理方法及色谱条件优化[D]. 晋中: 山西农业大学, 2017. ZHANG T. Pretreatment method and optimization of chromatographic conditions for the detection of N-nitrosamines in meat products[D]. Jinzhong: Shanxi Agricultural University, 2017.
[21] AKYÜZ M, ATA S, DINÇ E. A chemometric optimization of method for determination of nitrosamines in gastric juices by GC-MS[J]. Journal of Pharmaceutical and Biomedical Analysis,2016,117:26−36. doi: 10.1016/j.jpba.2015.08.021
[22] 侯慧文. 不同烤制程度下羊肉中杂环胺生成规律的研究[D]. 锦州: 渤海大学, 2021. HOU H W. Study on the formation law of heterocyclic amines in mutton under different roasting degrees[D]. Jinzhou: Bohai University, 2021.
[23] ALAM S, AHMAD R, PRANAW K, et al. Asparaginase conjugated magnetic nanoparticles used for reducing acrylamide formation in food model system[J]. Bioresource Technology,2018,269:121−126. doi: 10.1016/j.biortech.2018.08.095
[24] DOURADO C, PINTO C A, CUNHA S C, et al. A novel strategy of acrylamide mitigation in fried potatoes using asparaginase and high pressure technology[J]. Innovative Food Science and Emerging Technologies,2020,60:102310. doi: 10.1016/j.ifset.2020.102310
[25] ZUO S, ZHANG T, JIANG B. et al. Reduction of acrylamide level through blanching with treatment by an extremely thermostable L-asparaginase during French fries process[J]. Extremophiles,2015,19(4):841−851. doi: 10.1007/s00792-015-0763-0
[26] 李潇潇. 肉制品中丙烯酰胺形成规律的研究[D]. 天津: 天津科技大学, 2016. LI X X. Study on formation regularity of acrylamide in meat products[D]. Tianjin: Tianjin University of Science and Technology, 2016.
[27] DONG H, ZENG X F, BAI W D. Solid phase extraction with high polarity Carb/PSA as composite fillers prior to UPLC-MS/MS to determine six bisphenols and alkylphenols in trace level hotpot seasoning[J]. Food Chemistry,2018,258:206−213. doi: 10.1016/j.foodchem.2018.03.074
[28] FLORES M, MORA L, REIG M, et al. Risk assessment of chemical substances of safety concern generated in processed meats[J]. Food Science and Human Wellness,2019,8(3):244−251. doi: 10.1016/j.fshw.2019.07.003
[29] 朱清清. 腊肉加工过程中亚硝胺生成规律及其控制研究[D]. 天津: 天津科技大学, 2015. ZHU Q Q. Research on the formation law and control of nitrosamines in the processing of bacon[D]. Tianjin: Tianjin University of Science and Technology, 2015.
[30] HASKARACA G, DEMIROK SONCU E, KOLSARICI N, et al. Heterocyclic aromatic amines content in chicken burgers and chicken nuggets sold in fast food restaurants and effects of green tea extract and microwave thawing on their formation[J]. Journal of Food Processing and Preservation,2017,41(6):e13240. doi: 10.1111/jfpp.13240
[31] GU Y S, KIM I S, AHN J K. Mutagenic and carcinogenic heterocyclic amines as affected by muscle types/skin and cooking in pan roasted mackerel[J]. Mutatation Research,2020,515(1−2):189−195.
-
期刊类型引用(5)
1. 王月蓉,赵广河,赵丰丽,覃云斌,陈静,张弘. 脐橙皮水溶性膳食纤维提取工艺优化及其体外益生活性评价. 广西师范大学学报(自然科学版). 2025(01): 101-109 .  百度学术
百度学术
2. 沈康,郭瑞成,徐天旭,王伟华. DEAE-52纤维素柱层析纯化处理对西梅可溶性膳食纤维的影响. 食品与发酵工业. 2024(17): 209-217 . 百度学术
3. 卢翠文,欧萍,叶有明,何晓燕,杨东美. 微波辅助酶法提取茶酒糟中可溶性膳食纤维及其抗氧化性能研究. 饲料研究. 2024(20): 75-79 . 百度学术
4. 池玉闽,董怡,何强,张文学,向燕,何培君,邓莎,何贵萍,贾利蓉. 油橄榄果肉和核壳中膳食纤维的功能特性分析. 现代食品科技. 2023(05): 157-163 . 百度学术
5. 王虎玄,赵天添,王聪,张一凡,朱亚南,孙宏民. 陕北狗头红枣可溶性膳食纤维提取工艺优化及其理化特性与抗氧化活性研究. 陕西科技大学学报. 2022(05): 54-62+99 . 百度学术
其他类型引用(2)
 下载:
下载:


计量
- 文章访问数: 262
- HTML全文浏览量: 38
- PDF下载量: 23
- 被引次数: 7