


Development and Optimization of a Rapid Detection Model for Characteristic Nutrient Content in Highland Barley
-
摘要: 本文以76份青稞为研究对象,利用近红外光谱仪采集青稞4000~10000 cm−1波段光谱,并联合其水分、β-葡聚糖、直链淀粉、蛋白质实测含量数值,构建了基于近红外光谱技术的青稞特征营养成分含量快速检测模型。结果显示,SG卷积平滑(Savitzky Golay,SG)是水分、直链淀粉、β-葡聚糖含量的偏最小二乘法(Partial Least Squares,PLS)预测模型的最优光谱预处理方法,而SG卷积平滑+多元散射校正(Multiplicative Scatter Correction,MSC)是蛋白质含量的偏最小二乘法(PLS)预测模型的最优光谱预处理方法。为进一步提高青稞各成分含量预测模型的准确性,考察了竞争性自适应重加权法(Competitive Adaptive Reweighted Sampling,CARS)、连续投影算法(Successive Projections Algorithm,SPA)和变量组合集群分析混合迭代保留信息变量法(Variables Combination Population Analysis and Iterative Retained Information Variable,VCPA-IRIV)特征波长选择算法对模型预测结果的影响。结果表明,VCPA-IRIV处理可有效提高水分、直链淀粉、蛋白质含量预测模型的预测决定系数,降低预测均方根误差;CARS对β-葡聚糖含量预测模型优化效果显著。基于上述最优方法建立的青稞水分、β-葡聚糖、直链淀粉、蛋白质实测含量预测模型,其预测相关系数分别为0.9868、0.9808、0.9701、0.9879;预测均方根误差分别为0.2042、0.1846、0.8135、0.2095。综上,本研究建立的基于近红外光谱的青稞特征营养成分含量快速检测模型具有较高的准确性,对加工企业快速了解原料品质及高效筛选合格原料有一定指导意义。Abstract: In this paper, the highland barley moisture, β-glucan, amylopectin and protein content rapid detection model was established based on the 4000~10000 cm−1 near-infrared spectrum and actual contents of 76 highland barleys. The results showed that SG convolution smoothing was the optimal spectral preprocessing method for the partial least squares (PLS) prediction model of moisture, amylopectin and β-glucan contents, while SG convolution smoothing+multiplicative scatter correction (MSC) was the optimal spectral preprocessing method for the PLS prediction model of protein content. In order to further improve the accuracy of the prediction model, the different characteristic wavelength selection algorithms including competitive adaptive reweighted sampling (CARS), successive projections algorithm (SPA) and variables combination population analysis and iterative retained information variable (VCPA-IRIV) were used on the prediction results of the model. The results showed that VCPA-IRIV treatment could effectively improve the determination coefficient of prediction of moisture, amylose and protein content prediction model, and reduce the root mean square error of prediction. The treatment of CARS had a remarkable effect on the prediction accuracy for the β-glucan content. Ultimately, the established prediction models of moisture, β-glucan, amylopectin and protein content for highland barley had good prediction accuracy with the appropriate Rp (0.9868, 0.9808, 0.9701 and 0.9879) and RMSEP (0.2042, 0.1846, 0.8135 and 0.2095) value, respectively. In conclusion, the rapid detection model of highland barley characteristic nutrient content based on near infrared spectroscopy established in this study had high accuracy, which would have certain guiding significance for processing enterprises to quickly understand the quality of raw materials and efficiently screen qualified raw materials.
-
Keywords:
- Fourier transform near-infrared spectroscopy /
- highland barley /
- moisture /
- β-glucan /
- amylose /
- protein
-
青稞(Hordeum vulgare L. var. nudum Hook.f.)为禾本科大麦属一年生草本植物,又被称为裸大麦[1],在我国主要分布于海拔2000 m以上的高原地区[2]。青稞富含淀粉、蛋白质、膳食纤维等营养成分且组成配比合理,同时青稞还具有降血脂[3]、降血糖[4]、抗氧化[5]、预防或辅助改善II型糖尿病[6]等功能,因此其营养功效价值较高,开发前景广阔。青稞是青藏高原地区人们的传统主粮,随着人们对青稞营养保健功效的深入认识,近年来其作为主要原料被广泛应用于现代食品加工中。青稞原料品质是影响其加工产品质量的关键因素,因此研究人员曾对青稞中常规及特征成分含量展开了深入研究。青稞水分的含量一般在9.07%~14.7%,水分含量是检测青稞干燥程度的重要指标,较低的水分含量能延长青稞的贮藏时间、维持其物理化学稳定性[7]。β-葡聚糖、直链淀粉和蛋白质是青稞主要营养成分,含量一般在3.66%~8.62%、1.65%~31.2%和6.10%~23.4%左右[8−10]。其中β-葡聚糖和直链淀粉含量的高低不仅影响青稞感官品质和加工特性,还是衡量谷物品质的重要指标,例如,当β-葡聚糖含量高的青稞用于酿酒时,较大的黏度会导致出酒率降低,当直链淀粉含量低时,面条的软度、黏性、光滑性、口感和综合评分等均有较好表现[11−13]。而蛋白质则可以作为挑选不同加工方式的依据之一,例如,高蛋白质含量的青稞适用于特色食品加工,中低蛋白含量的青稞适用于酿造青稞啤酒[14]。
目前,青稞中水分、β-葡聚糖、直链淀粉和蛋白质的检测通常采用直接干燥法、酶法、分光光度法、凯氏定氮法等常规方法,虽然测定结果精准,但面对大量样本时,存在分析成本高、耗时长、样品前处理复杂等问题,一定程度限制了加工企业对原料质检的效率。因此,开发建立一种操作简便、检测快速、成本低廉的青稞特征营养成分含量检测方法,对加工企业快速了解原料品质及高效筛选合格原料具有重要意义。近红外光谱分析技术是一种新型的定性、定量分析技术,其因快速、简便、低成本的检测特点受到了研究人员的广泛关注。高慧宇等[15]基于近红外光谱技术建立了小麦粉常规营养成分含量的检测模型,并实现小麦粉中的蛋白质、水分和脂肪含量的快速、精准检测。此外,近红外光谱技术还成功应用于玉米[16]、大米[17]、藜麦粉[18]等营养成分的快速检测,但在青稞中却鲜有研究。
因此本文借助近红外光谱技术,建立青稞中水分、β-葡聚糖、直链淀粉和蛋白质含量的快速检测方法,并进一步通过光谱预处理及特征波长筛选等方法优化模型,增强检测准确性,以期为实现高效便捷地检测青稞特征营养成分含量提供参考和技术支持。
1. 材料与方法
1.1 材料与仪器
青稞样品 共76份,由农业农村部杂粮加工重点实验室提供,参试材料涵盖了西藏、青海、甘肃、四川等我国青稞的主要产区,见表1;Megazyme混联β-葡聚糖检测试剂盒 爱尔兰Megazyme公司;直链淀粉试剂盒、植物蛋白提取试剂盒、双缩脲法蛋白含量检测试剂盒 北京索莱宝生物科技有限公司。
表 1 参试青稞信息Table 1. Information of hulless highland barleys编号 样品名称 产地 编号 样品名称 产地 编号 样品名称 产地 1 SS-1 西藏 27 SS-27 西藏 52 CDU-34(康青9号) 四川 2 SS-2 青海 28 SS-28 青海 53 CDU-35(藏青2000) 四川 3 SS-3 青海 29 SS-29 西藏 54 CDU-36(柴青1号) 青海 4 SS-4 西藏 30 SS-30 西藏 55 CDU-37 四川 5 SS-5 甘肃 31 SS-31 西藏 56 CDU-38 四川 6 SS-6 青海 32 SS-32 − 57 CDU-39 四川 7 SS-7 西藏 33 SS-33 − 58 CDU-40(昆仑14) 青海 8 SS-8 青海 34 SS-34 青海 59 CDU-41(昆仑15) 青海 9 SS-9 青海 35 SS-35 − 60 CDU-42(昆仑16) 青海 10 SS-10 西藏 36 SS-36 西藏 61 CDU-43(昆仑17) 青海 11 SS-11 西藏 37 SS-37 西藏 62 CDU-45 西藏 12 SS-12 西藏 38 CDU-14(AB-长青) 四川 63 CDU-47 青海 13 SS-13 西藏 39 CDU-15(黑六棱 ) 西藏 64 CDU-48 青海 14 SS-14 − 40 CDU-16 四川 65 CDU-49 青海 15 SS-15 西藏 41 CDU-17 西藏 66 CDU-50 青海 16 SS-16 西藏 42 CDU-18 西藏 67 CDU-51 青海 17 SS-17 青海 43 CDU-19(藏青2000) 西藏 68 CDU-52 青海 18 SS-18 甘肃 44 CDU-20(康青6号) 四川 69 CDU-53 青海 19 SS-19 青海 45 CDU-21(康青7号) 四川 70 CDU-54 青海 20 SS-20 西藏 46 CDU-22(康青9号) 四川 71 CDU-55 青海 21 SS-21 西藏 47 CDU-23 四川 72 CDU-56(藏青17) 西藏 22 SS-22 西藏 48 CDU-27(甘孜丹巴1号) 四川 73 CDU-57(藏青18) 西藏 23 SS-23 西藏 49 CDU-28(甘孜甲居1号) 四川 74 CDU-58(藏青320) 西藏 24 SS-24 西藏 50 CDU-29 四川 75 CDU-59 西藏 25 SS-25 − 51 CDU-33(肚里黄) 青海 76 CDU-60 西藏 26 SS-26 陕西 注:自主收集(CDU-),市售产品(SS-),−表示产地不明。 NIRFIex N500傅里叶近红外光谱仪 瑞士Buchi步琦公司;CP214分析天平 美国OHAUS公司;DGG-9246A电热恒温鼓风干燥箱 上海齐欣科学仪器有限公司;Synergy HTX多功能微孔板检测仪 美国BioTek公司;DZKW-S-4电热恒温水浴锅 北京市光明医疗仪器有限公司;KQ-400E超声仪 昆山市超声仪器有限公司;QL-901旋涡混合器 海门市其林贝尔仪器制造有限公司;UPHW-IV-90T超纯水仪 四川优普超纯科技有限公司。
1.2 实验方法
1.2.1 样品处理
每份青稞取25 g于高速万能粉碎机中粉碎,过65目筛备用,储存在干燥密闭容器中。
1.2.2 营养成分的测定
1.2.2.1 水分含量的测定
参照食品安全国家标准GB 5009.3-2016《食品中水分的测定》中的直接干燥法。
1.2.2.2 β-葡聚糖含量的测定
采用Megazyme混联β-葡聚糖检测试剂盒进行测定,每个样品测三次平行,取平均值作为定量分析模型的参考值[19]。
1.2.2.3 直链淀粉含量的测定
采用直链淀粉试剂盒进行测定,每个样品测三次平行,取平均值作为定量分析模型的参考值[20]。
1.2.2.4 蛋白质含量的测定
联用植物蛋白提取试剂盒与双缩脲法蛋白含量检测试剂盒进行测定,每个样品测三次平行,取平均值作为定量分析模型的参考值[21−22]。
1.2.3 样品光谱数据采集
利用傅里叶变换近红外仪扫描所有青稞样品进行光谱采集,在室温条件下将仪器预热30 min,采用方式为透射扫描,样品载于8 mm直径样品皿中,扫描波长范围4000~10000 cm−1,波长间隔2 nm,扫描次数为64次。每个样品平行采集3次,取其平均值作为最终结果。
1.2.4 数据分析与建模
1.2.4.1 异常数据剔除方法
对测定获得的青稞光谱数据进行异常值测试并剔除异常值。利用马氏距离(Mahalanobis Distance,MD)选择前2%的马氏距离作为阈值,剔除MD过大的样本[23]。
1.2.4.2 光谱预处理方法
为最大限度减小非目标因素的影响,保留光谱有效信息,采用SG卷积平滑、标准正态变换(SNV)、多元散射校正(MSC)、SG卷积平滑+MSC、MSC+SNV对光谱进行预处理,以提高模型的稳健性。
1.2.4.3 特征波长筛选方法
为减少存在冗余和多重共线性信息,提高模型的预测性能,采用竞争性自适应重加权法(CARS)、连续投影算法(SPA)和变量组合集群分析混合迭代保留信息变量(VCPA-IRIV)筛选特征波长。CARS选择波数的方法是基于回归系数的权重,权重值越大则代表该变量对模型建立的贡献越大,被选取的概率越大。SPA以正交投影分析全部波长变量,并保留对青稞水分、β-葡聚糖、直链淀粉和蛋白质敏感的特征变量,使变量之间共线性达到最小,降低模型输入量[24−25]。VCPA-IRIV消除了最差子集对特征变量的不利影响,将剩余变量集中优化,选择最优子集。
1.2.4.4 预测建模方法
采用SG卷积平滑、SNV、MSC、SG卷积平滑+MSC、MSC+SNV等方法对光谱进行预处理后,对比不同的预处理的结果,选取最优结果进行特征波长变量选择,对最优波段使用偏最小二乘法(PLS)模型建模,其原理如下式。
Y=bX+e 式中,Y为化学值含量;b为回归系数的向量;X为光谱数据;e为模型残差。
1.2.4.5 模型的构建及评价
以校正相关系数(Determination Coefficient of Calibration,Rc)、校正均方根误差(Root Mean Squared Error of Calibration,RMSEC)、预测相关系数(Determination Coefficient of Prediction,Rp)和预测均方根误差(Root Mean Squared Error of Prediction,RMSEP)对所有模型质量进行定量比较,确定最优检测模型。Rc、Rp值越大,RMSEC、RMSEP值越小,模型的预测性能越好。
1.3 数据处理
所有实验均进行三次生物学重复,取其平均值。使用NIRFIex N500进行傅里叶近红外光谱采集,Matlab 2022进行模型构建、分析并绘图,SPSS statistics 22.0软件进行检验。
2. 结果与分析
2.1 青稞中营养成分的含量
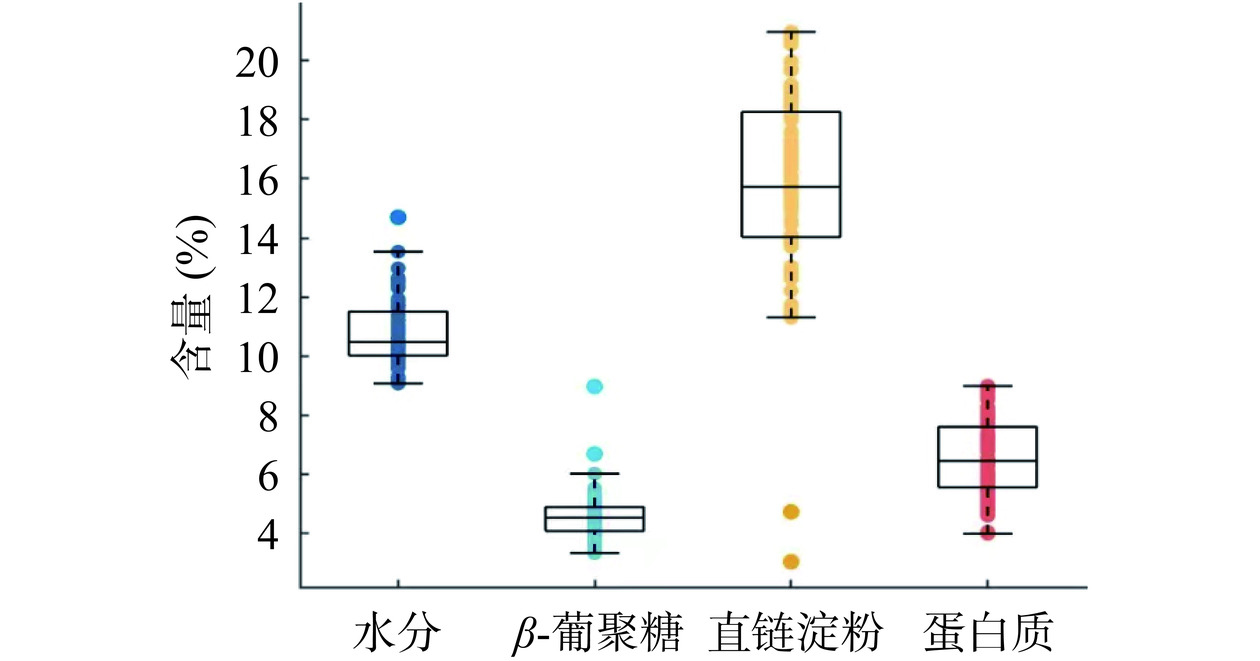
对76份青稞样品的水分、β-葡聚糖、直链淀粉、蛋白质含量进行含量测定,结果见图1。其中,水分的最高含量为14.7%,最低含量为9.07%,平均含量为10.78%。β-葡聚糖的最高含量为8.96%,最低含量为3.33%,平均含量为4.57%。直链淀粉的最高含量为20.97%,最低含量为3.03%,平均含量为15.84%。蛋白质的最高含量为8.99%,最低含量为3.99%,平均含量为6.57%。实验样本各营养成分含量值与已有报道基本相符,且变幅合适,表明所选青稞具有较好的代表性,适合用于建立近红外光谱分析模型。
![]() 图 1 青稞水分、直链淀粉、β-葡聚糖、蛋白质的实测含量Figure 1. Measured contents of moisture, amylose, β-glucan and protein in highland barleys
图 1 青稞水分、直链淀粉、β-葡聚糖、蛋白质的实测含量Figure 1. Measured contents of moisture, amylose, β-glucan and protein in highland barleys2.2 剔除异常样本
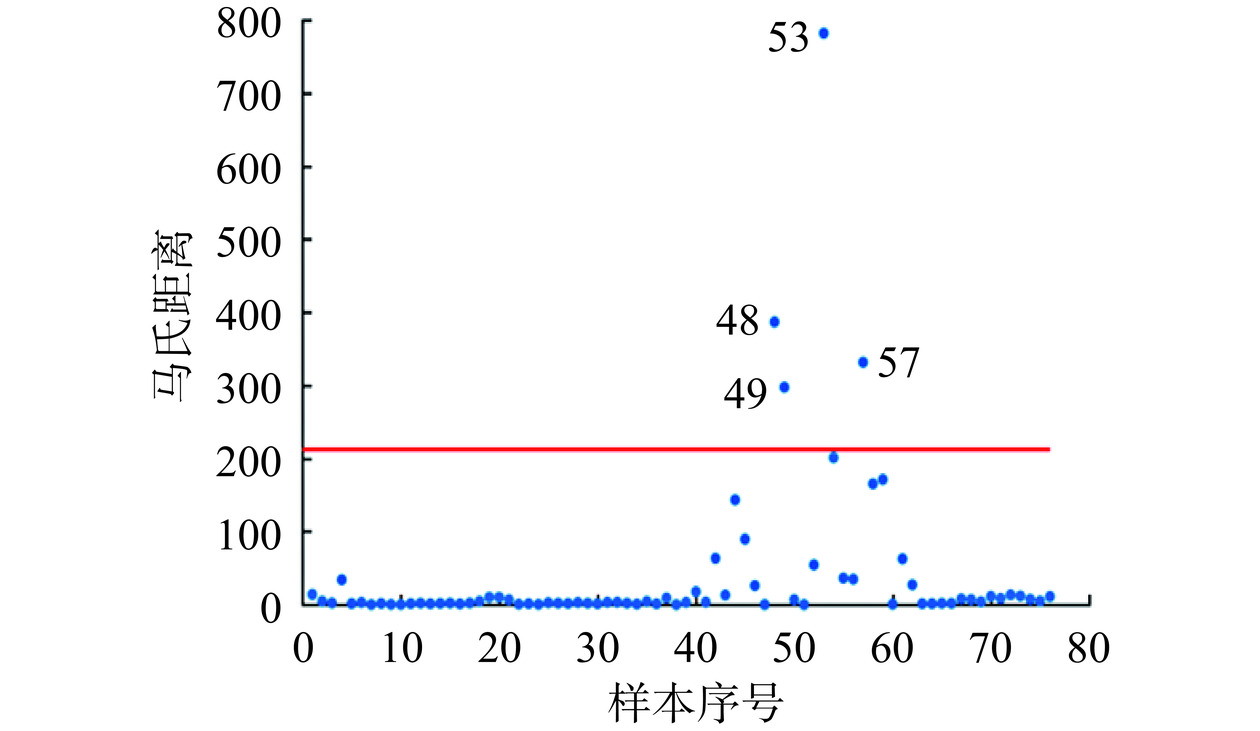
马氏距离是一种有效的计算样本与样本集“重心”最近距离,以及不同样本集相似度的方法。马氏距离通过考虑各种特性之间的联系,可以排除变量之间的相关性的干扰。在采集的所有样品数据中,受样品、采集环境和仪器的影响,一定程度上会存在异常样品数据,因此在建模之前使用马氏距离剔除异常样本数据,将有效提高建模准确性。图2是76个青稞样本平均光谱的马氏距离分布图。根据马氏距离的均值和标准偏差得到阈值为212.2,超出此阈值的异常样本共4个,分别为48号、49号、53号、57号。
![]() 图 2 青稞样本的马氏距离分布Figure 2. Distribution of Mahalanobis distance of highland barley samples
图 2 青稞样本的马氏距离分布Figure 2. Distribution of Mahalanobis distance of highland barley samples2.3 近红外光谱样本集划分
将剔除异常值后的72个样本,参照Liu等[26]的方法,按照3:2比例划分为校正集和预测集。校正集和预测集样品水分、β-葡聚糖、直链淀粉和蛋白质含量的极差、均值、标准偏差和变异系数等数据如表2所示。结果显示,所测样本的水分、β-葡聚糖、直链淀粉和蛋白质含量梯度均匀,分布范围较广;所划分的12个集的变异系数较小,离散程度较小;整体样品数据符合正态分布,适用于近红外检测模型的建立。
表 2 青稞籽粒近红外光谱样本集数据分布特征Table 2. Distribution characteristics of near infrared spectrum sample set of highland barley grains分类 指标 样品数 最大值(%) 最小值(%) 极差(%) 平均值(%) 标准
偏差变异系数 校正集 水分 43 14.69 9.07 5.62 10.77 1.18 0.11 β-葡聚糖 43 6.69 3.33 3.35 4.51 0.63 0.14 直链淀粉 43 20.76 3.03 17.72 15.66 3.14 0.2 蛋白质 43 8.92 3.99 4.94 6.6 1.3 0.05 预测集 水分 29 14.69 9.11 5.59 10.75 1.2 0.11 β-葡聚糖 29 8.97 3.42 5.54 4.6 0.98 0.21 直链淀粉 29 20.97 4.73 16.25 15.68 3.21 0.2 蛋白质 29 8.99 4.04 4.94 6.55 1.36 0.21 综合集 水分 72 14.69 9.07 5.63 10.77 1.18 0.11 β-葡聚糖 72 8.97 3.33 5.63 4.55 0.78 0.17 直链淀粉 72 20.97 3.03 17.94 15.67 3.14 0.2 蛋白质 72 8.99 3.99 5 6.54 1.33 0.2 2.4 近红外光谱预处理
原始的近红外光谱包含与特定成分相关的有效信息,但是不可避免地会携带干扰信息,如检测过程中产生的噪音等。因此,对光谱进行预处理,能够有效消除与被测指标无关的变量信息,提高模型质量。本文运用SG卷积平滑、标准正态变换(SNV)、多元散射校正(MSC)、SG卷积平滑+MSC、MSC+SNV对原始光谱进行预处理[27−29]。
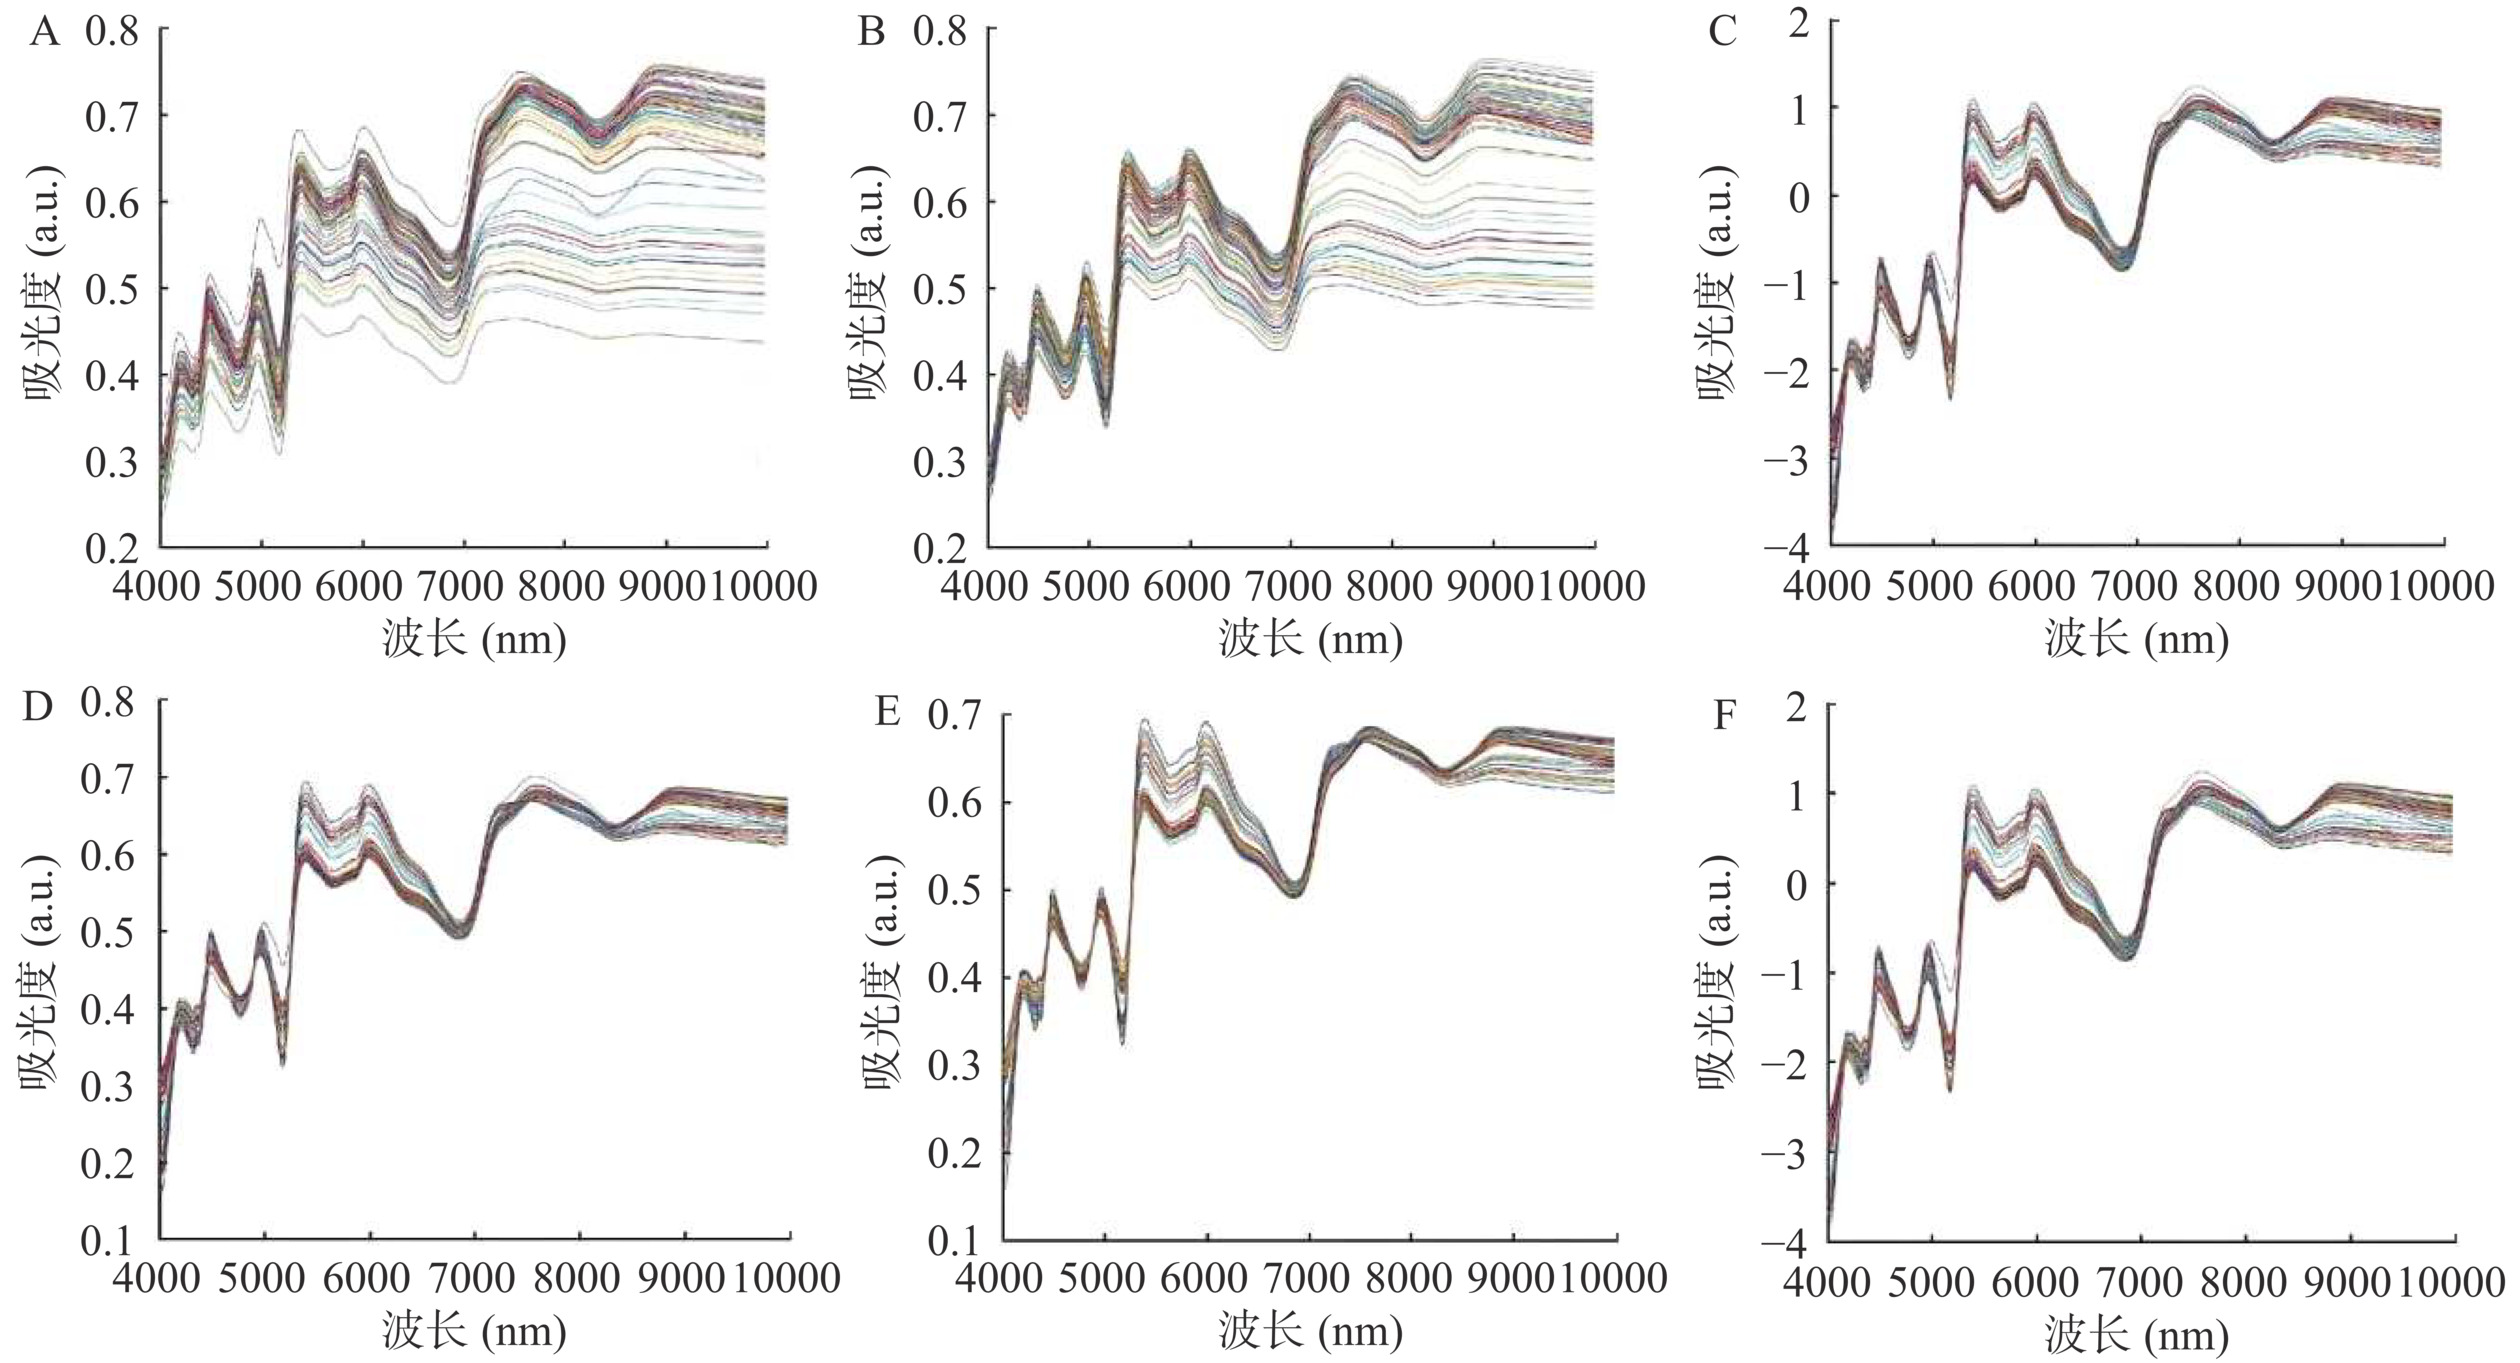
SG卷积平滑能够从整体上消除光谱中产生的噪声(图3A),使光谱更加平滑,但也去除了光谱中的一些细节,削弱了光谱的整体特征(图3B)。经SNV或MSC预处理后的光谱,消除了样品内组织分布不均造成的散射影响,使6900 nm和7100 nm的特征峰在光谱中更加明显(图3C和图3D)。因此,在进行进一步预处理或建模之前,有必要先使用SG卷积平滑滤除噪声,或者采用SNV等方法消除表面散射以及光程变化对光谱的影响。原始光谱分别经过SG卷积平滑+MSC、MSC+SNV处理后的光谱如图3E和图3F所示。
![]() 图 3 不同方法对青稞近红外光谱预处理的结果注:A. 原始光谱;B. SG卷积平滑;C. 标准正态变换(SNV);D. 多元散射校正(MSC);E. SG卷积平滑+MSC;F. MSC+SNV。Figure 3. Results of near-infrared spectroscopy pretreatment of highland barleys by different methods
图 3 不同方法对青稞近红外光谱预处理的结果注:A. 原始光谱;B. SG卷积平滑;C. 标准正态变换(SNV);D. 多元散射校正(MSC);E. SG卷积平滑+MSC;F. MSC+SNV。Figure 3. Results of near-infrared spectroscopy pretreatment of highland barleys by different methods分别使用原始光谱及经过5种预处理的光谱建立全波段的PLS预测模型,建模结果见表3。与原始光谱相比,经过预处理后所建立的PLS模型性能均有所提升。其中,水分、直链淀粉和β-葡聚糖采用SG卷积平滑处理,蛋白质采用SG卷积平滑+MSC处理的效果最佳。水分最佳PLS模型Rc为0.9759、Rp为0.9515,β-葡聚糖最佳PLS模型Rc为0.9221、Rp为0.9602,直链淀粉最佳PLS模型Rc为0.9854、Rp为0.9369,蛋白质最佳PLS模型Rc为0.9189、Rp为0.8356。
表 3 不同预处理方法PLS模型结果比较Table 3. Comparison of performance of PLS models with different pretreatment methods参数 预处理方法 LVS Rc RMSEC Rp RMSEP 水分 None 2 0.4461 1.0442 0.3533 1.1699 SG卷积平滑 10 0.9759 0.2547 0.9515 0.3914 SNV 2 0.4333 1.0515 0.3591 1.1416 MSC 2 0.4313 1.0526 0.3576 1.1422 SG卷积平滑+MSC 2 0.5191 0.9972 0.4738 1.0919 MSC+SNV 3 0.4333 1.0515 0.3591 1.1416 β-葡聚糖 None 6 0.6134 0.4398 0.6358 0.8262 SG卷积平滑 6 0.9221 0.2392 0.9602 0.4102 SNV 10 0.8865 0.2859 0.7267 0.6919 MSC 10 0.8933 0.2777 0.4410 0.9289 SG卷积平滑+MSC 10 0.1075 0.6144 0.1252 0.9596 MSC+SNV 1 0.8865 0.2859 0.7267 0.6919 直链淀粉 None 4 0.8622 1.5725 0.6998 2.2868 SG卷积平滑 10 0.9854 0.5279 0.9369 1.1747 SNV 4 0.8862 1.4378 0.7424 2.1505 MSC 6 0.8876 1.4295 0.7440 2.1394 SG卷积平滑+MSC 4 0.7925 1.4733 0.6319 3.3824 MSC+SNV 2 0.8862 1.4378 0.7424 2.1505 蛋白质 None 1 0.2028 1.2800 0.3812 1.2603 SG卷积平滑 3 0.3284 1.2347 0.4529 1.1984 SNV 4 0.4169 1.1882 0.5566 1.1234 MSC 4 0.3624 1.2183 0.6774 1.0504 SG卷积平滑+MSC 4 0.9189 0.5156 0.8356 0.7799 MSC+SNV 10 0.4567 1.1688 0.4112 1.2171 2.5 特征光谱筛选
在光谱预处理基础上,使用特征波长光谱筛选可以进一步简化模型,同时去除无关变量,建立更佳的预测模型,提升预测能力和稳健性[30−31]。目前,竞争性自适应重加权法(CARS)[32−34]、连续投影算法(SPA)[35−36]和变量组合集群分析混合迭代保留信息变量(VCPA-IRIV)等算法应用最为广泛[37]。
2.5.1 CARS筛选特征波长
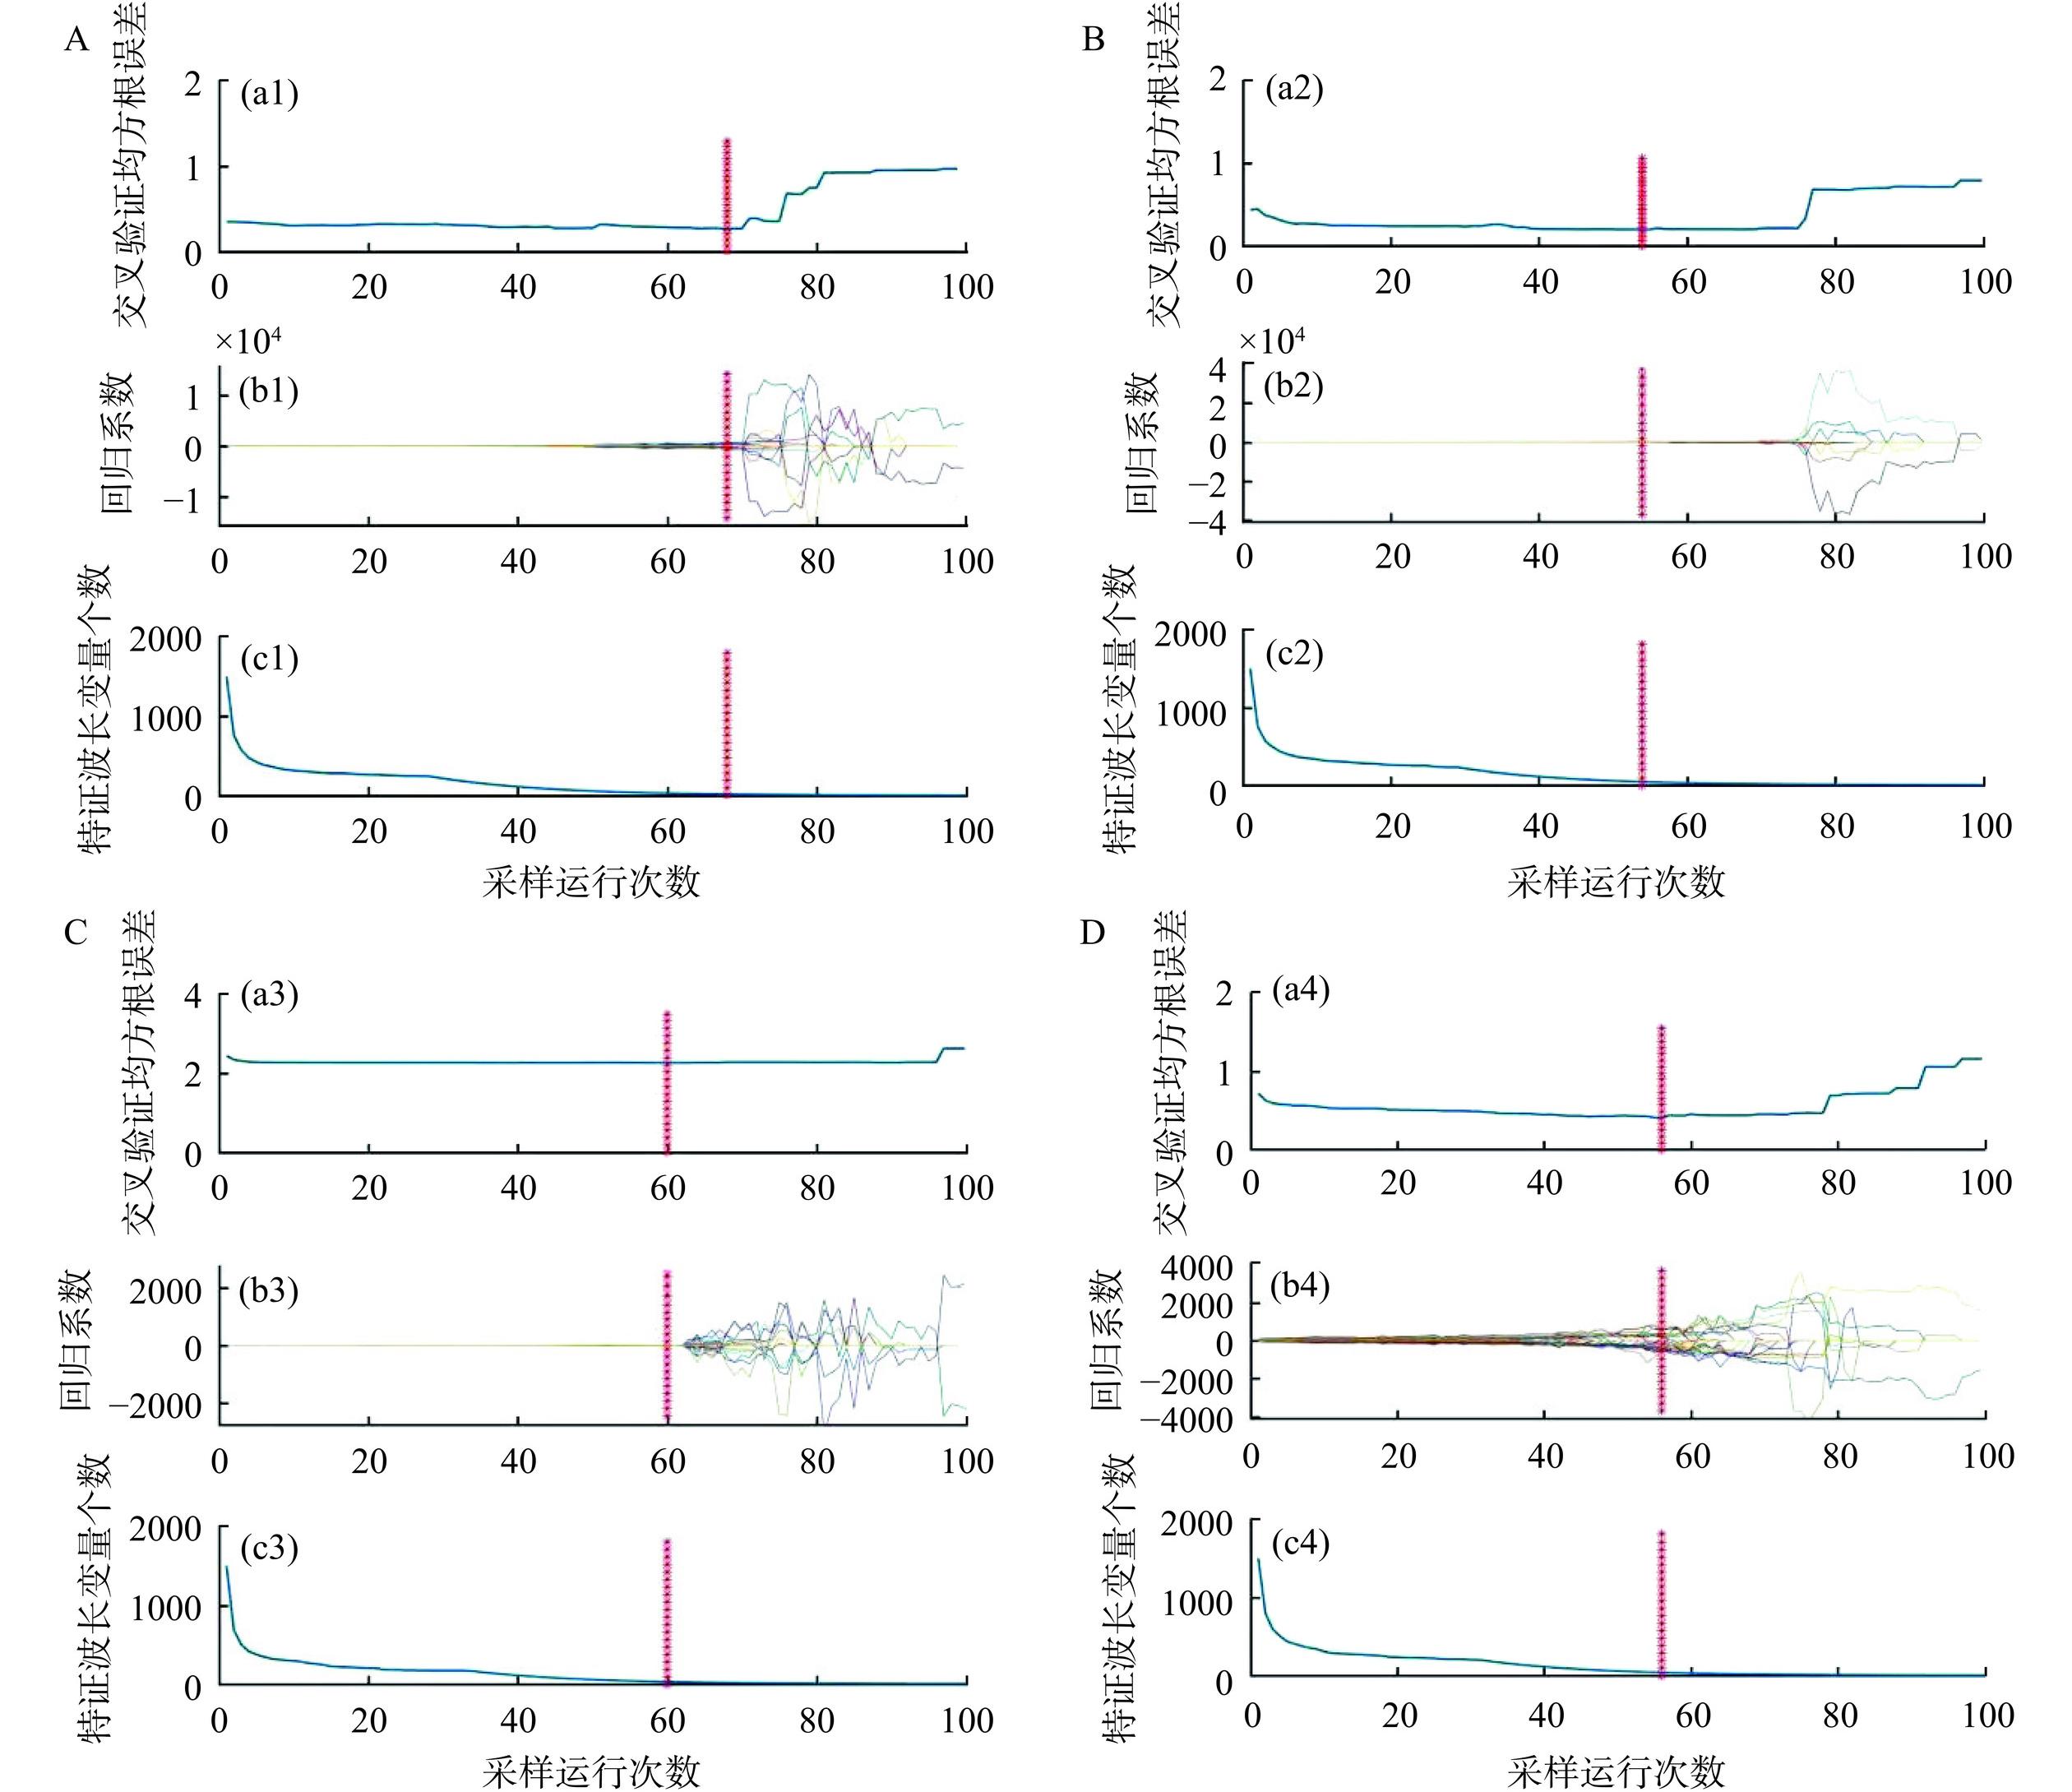
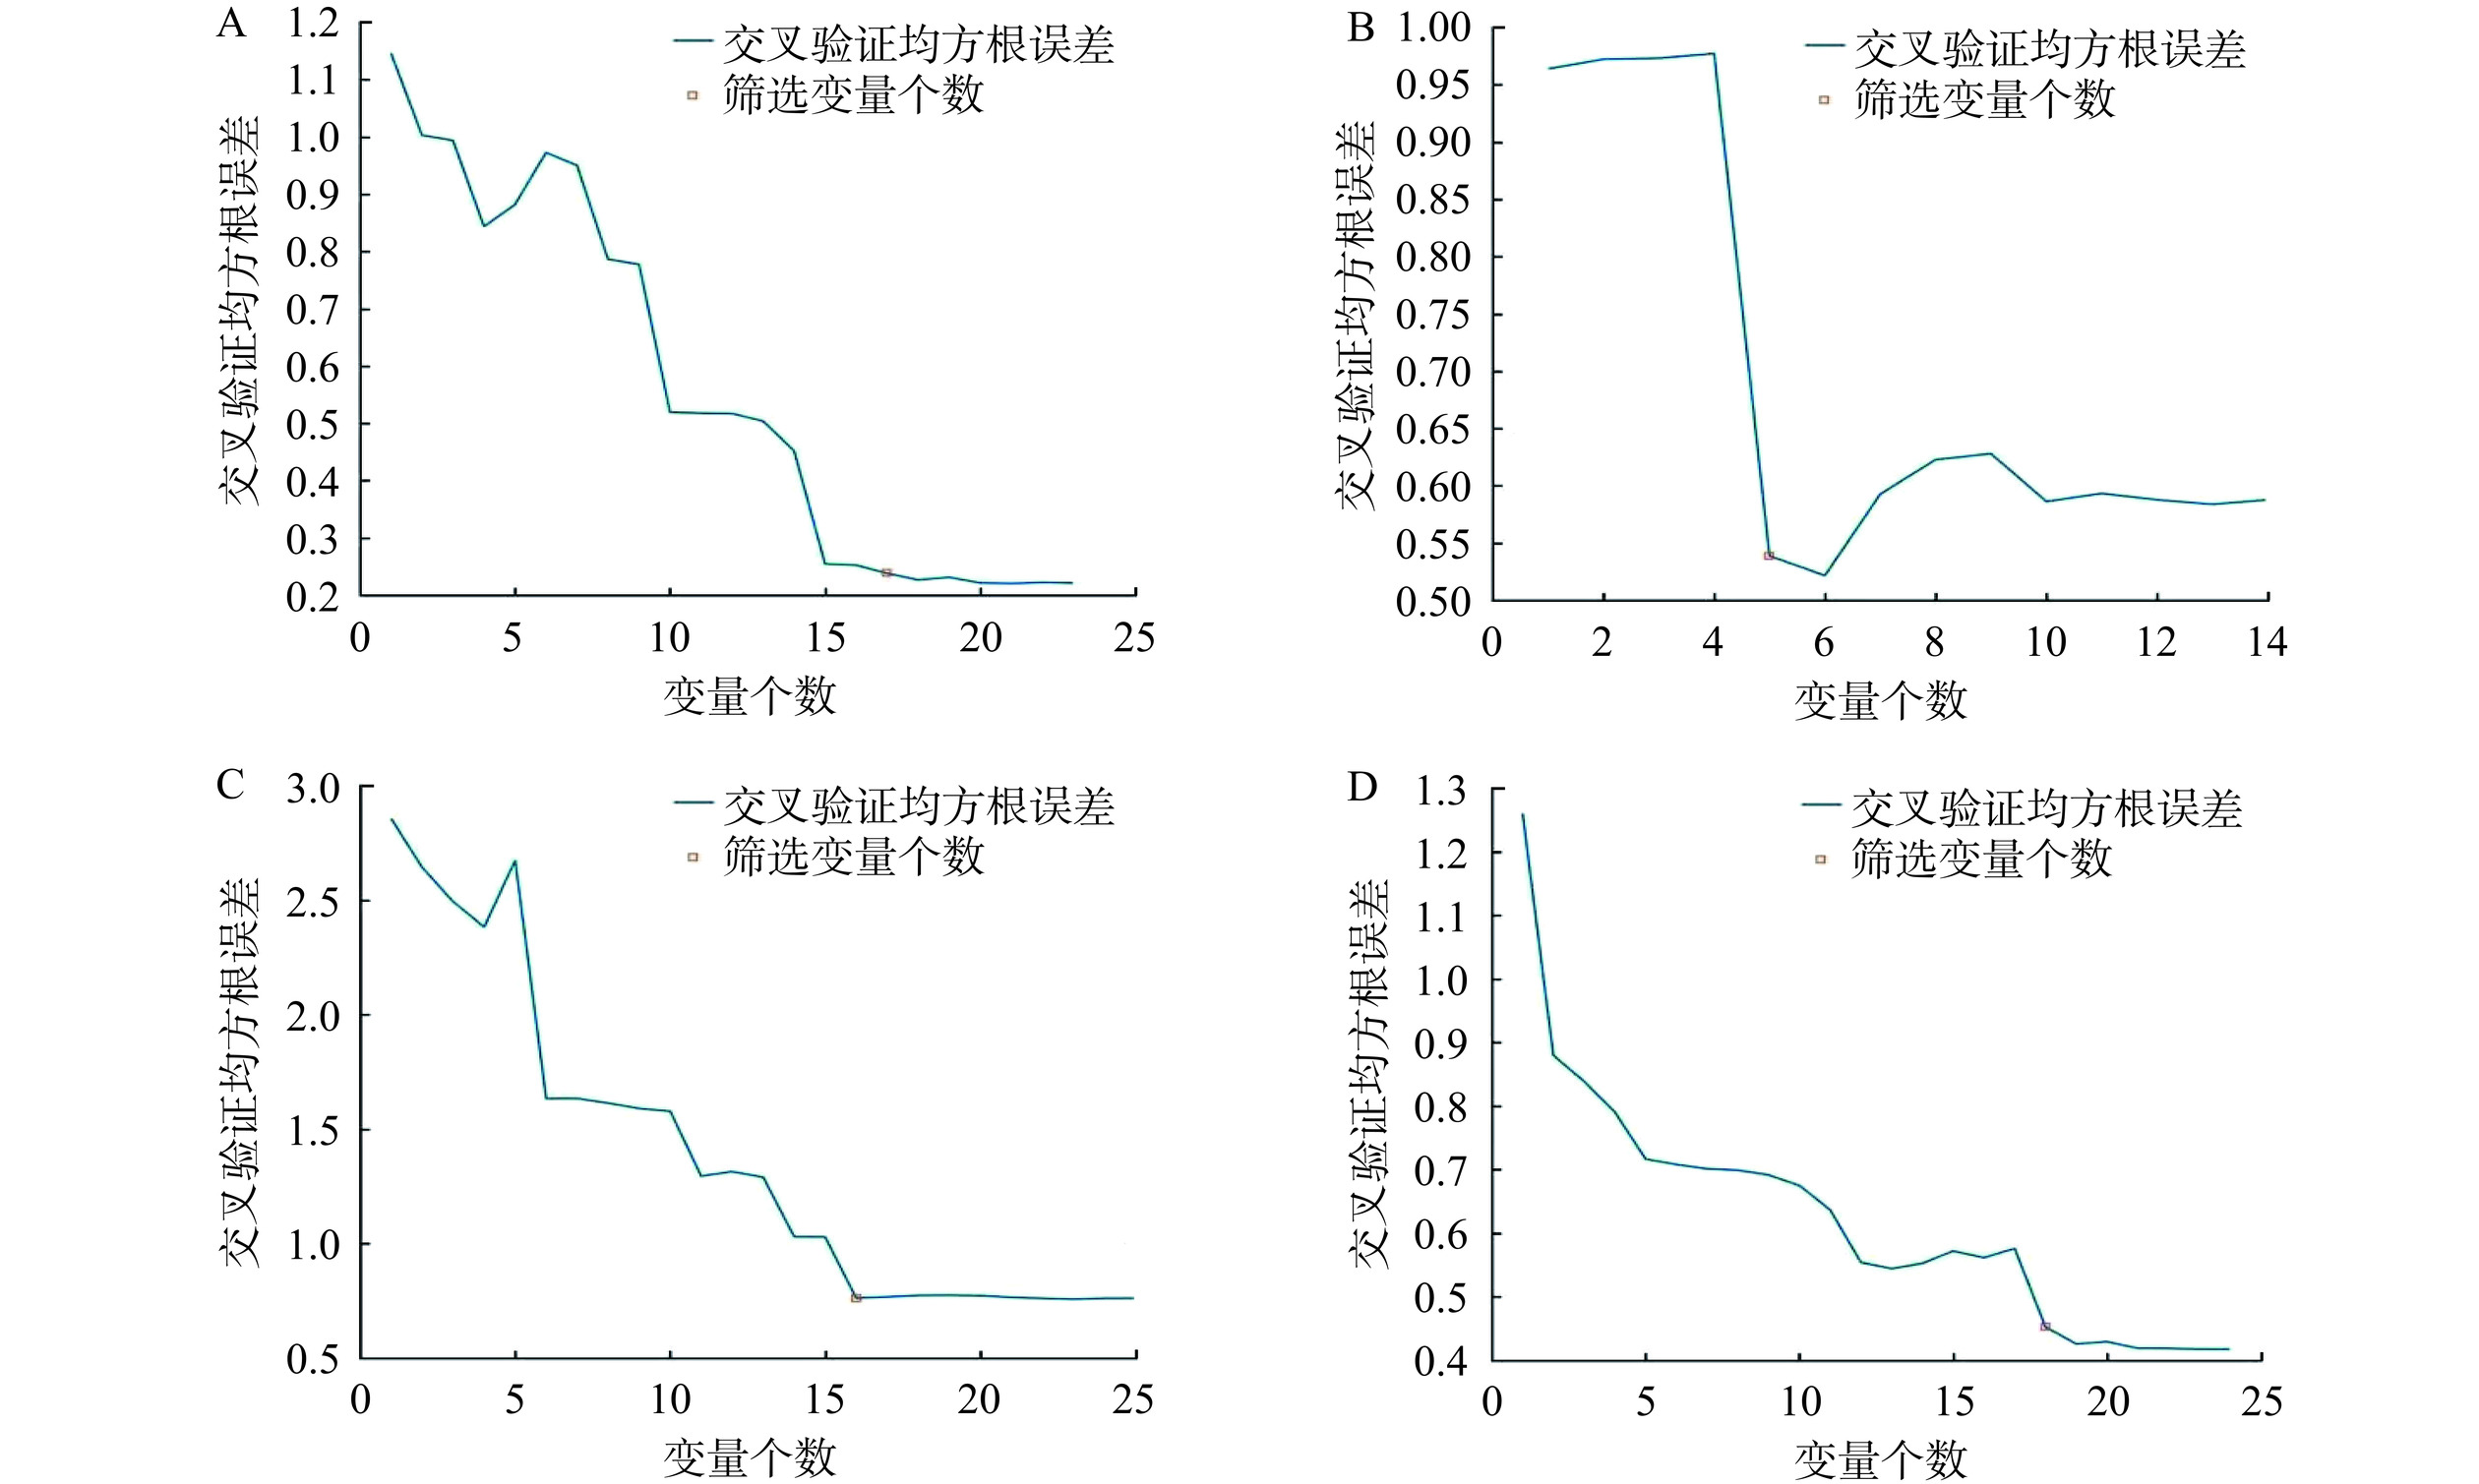
在CARS的特征选择过程中,设置蒙特卡罗采样次数为100,采用5折交叉验证的方法建立PLS模型,以交叉验证均方根误差(Root Mean Squared Error of Cross-Validation,RMSECV)最小值确定选择的最优特征组合。图4A分别表示在CARS算法运行中随着运行采样次数的增加,5折交叉验证均方根误差、每个变量回归系数和特征波长变量个数的变化。从图4的RMSECV值(a1、a2、a3、a4)可以看出,随着运行采样次数的增加,RMSECV的值呈现先下降后上升的趋势,在下降过程中,表明无用信息或者干扰信息正在被剔除,而在上升的过程中,表明有用信息正在被剔除。在图4变量回归系数(a2、b2、c2、d2)中,红色星号竖线表示最佳采样位置,此时RMSECV最低,选择的特征变量组合最优。在图4特征波长变量个数(c1、c2、c3、c4)中,随着采样运行次数的不断增加,选择的特征波长变量个数逐渐减少,且减少趋势逐渐变缓,体现了CARS在特征选择过程中的“粗选”和“精选”的过程。最终通过CARS分别筛选出了水分、β-葡聚糖、直链淀粉、蛋白质的特征变量为29、45、29、38个。
![]() 图 4 基于CARS的特征波长选择过程注:A. 水分;B. β-葡聚糖;C. 直链淀粉;D. 蛋白质。Figure 4. Characteristic wavelength selection process using CARS
图 4 基于CARS的特征波长选择过程注:A. 水分;B. β-葡聚糖;C. 直链淀粉;D. 蛋白质。Figure 4. Characteristic wavelength selection process using CARS2.5.2 SPA筛选特征波长
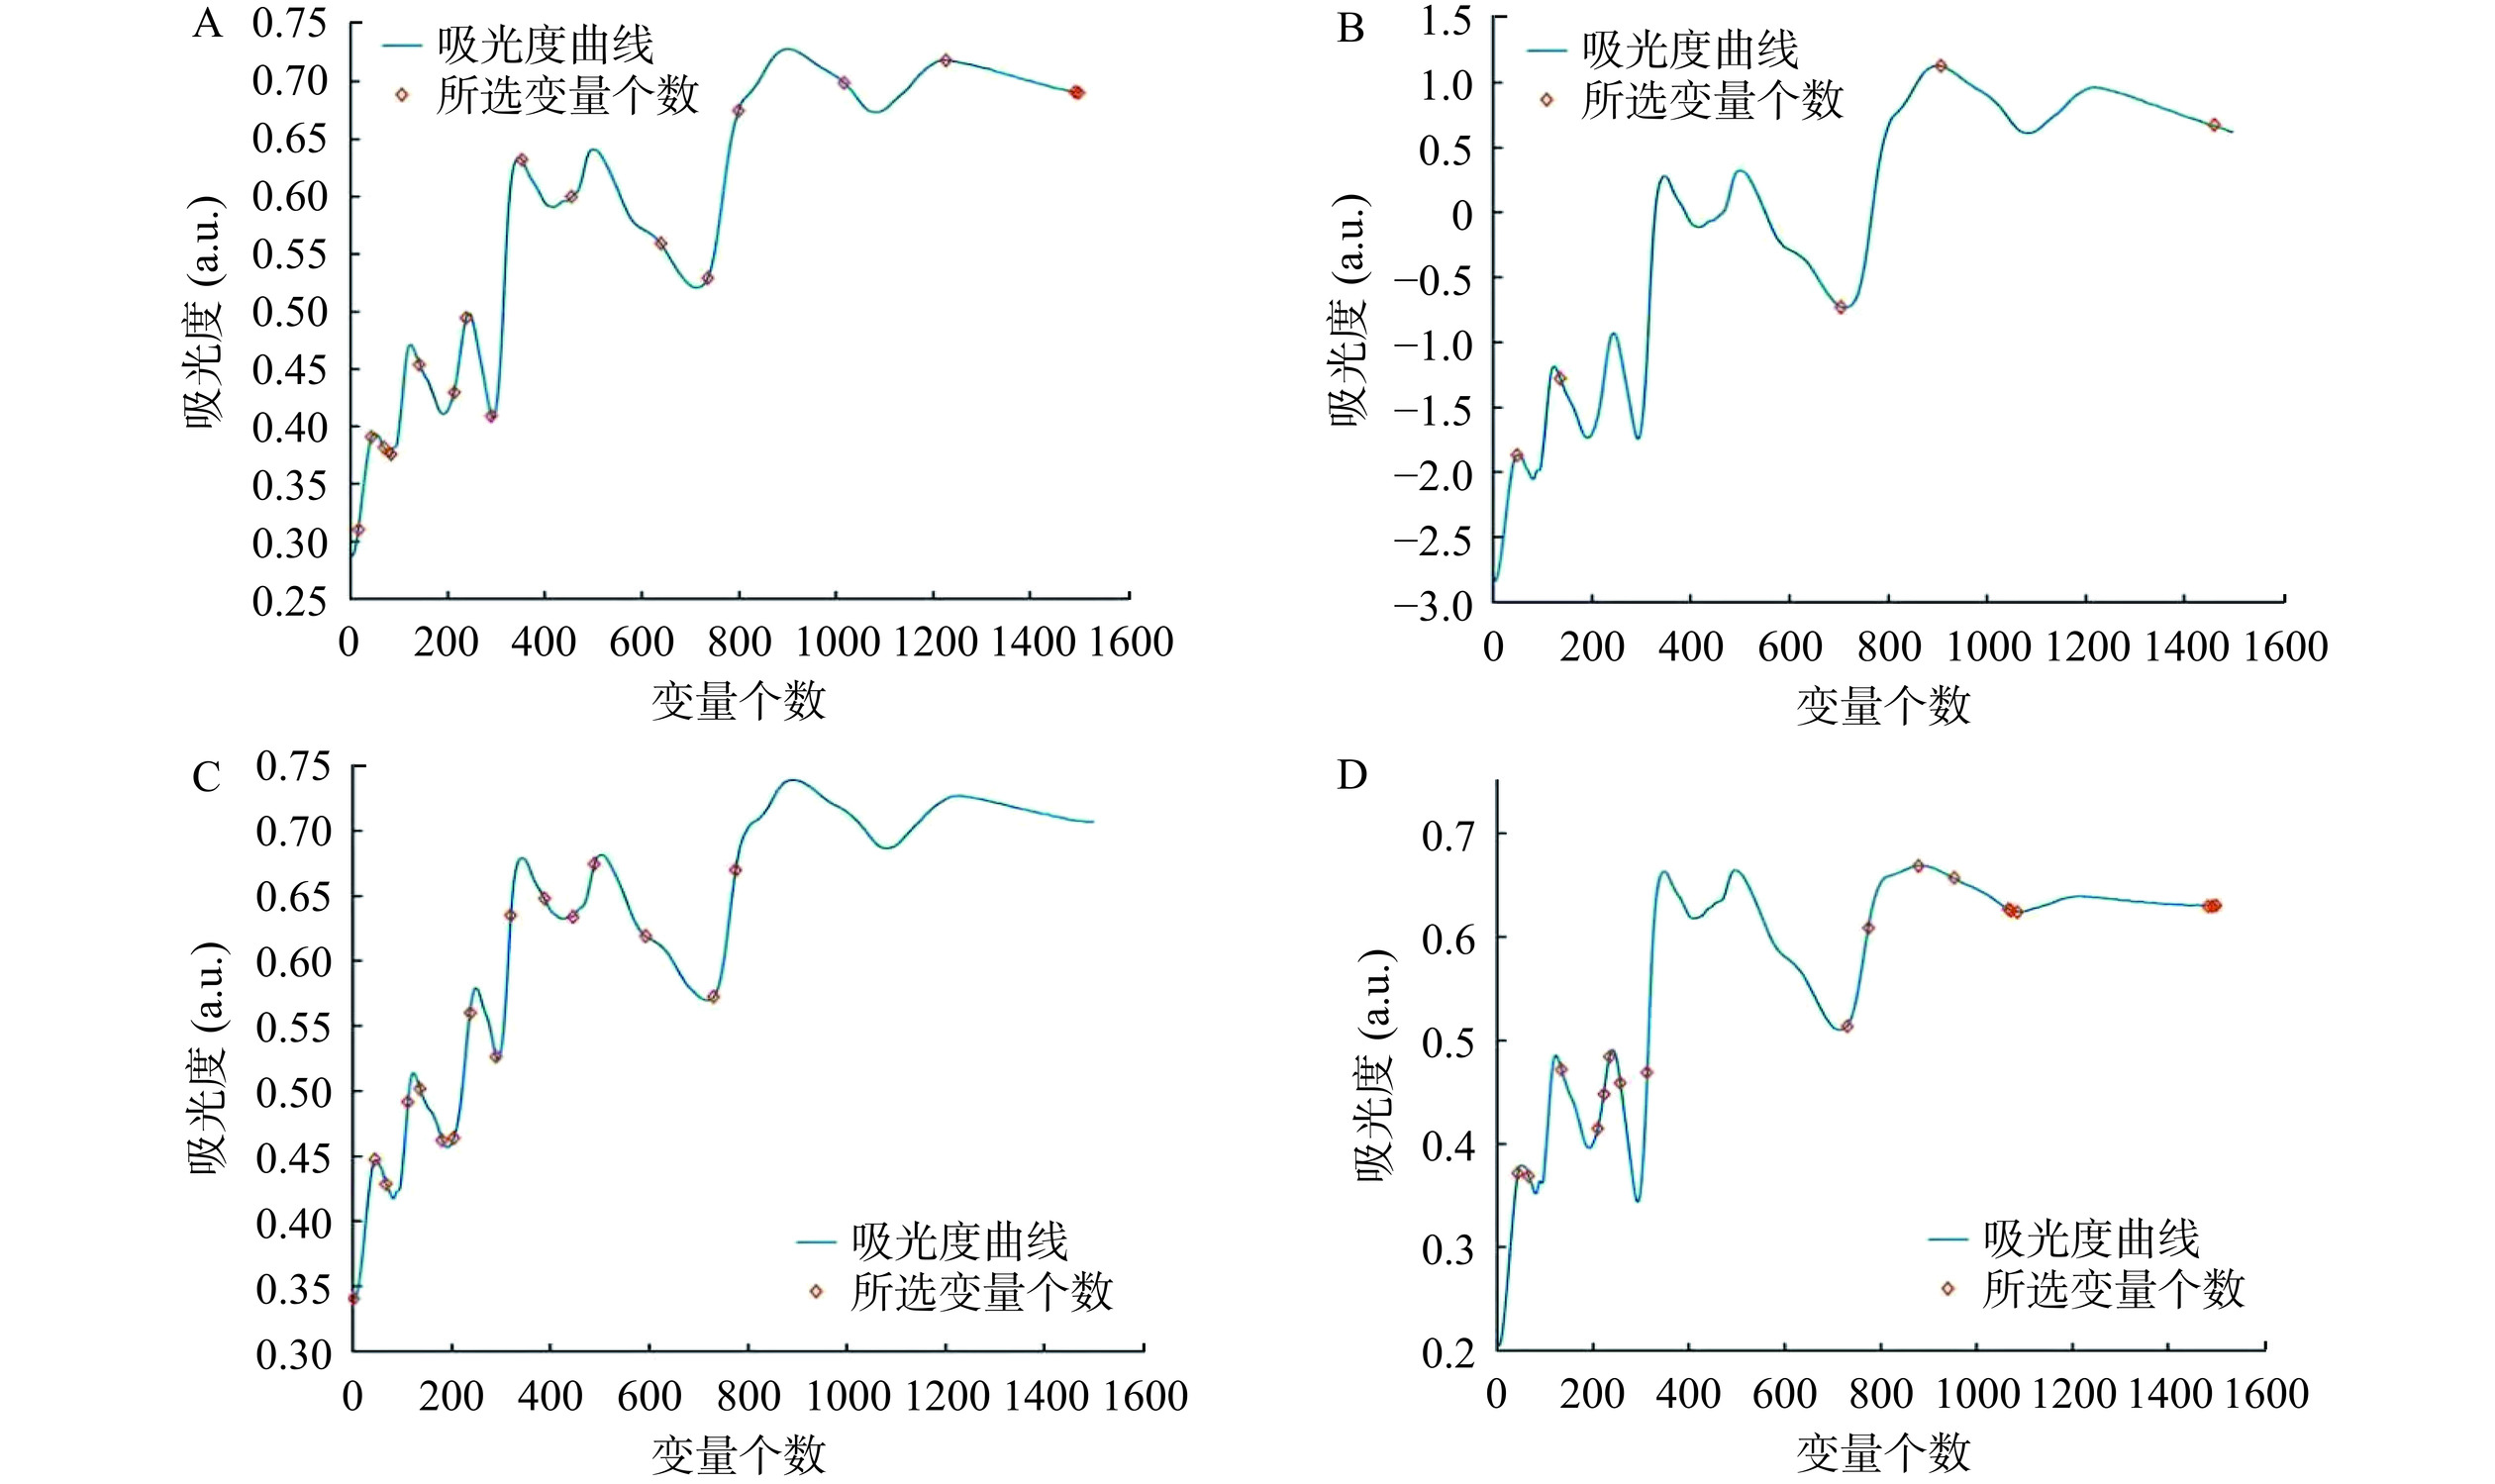
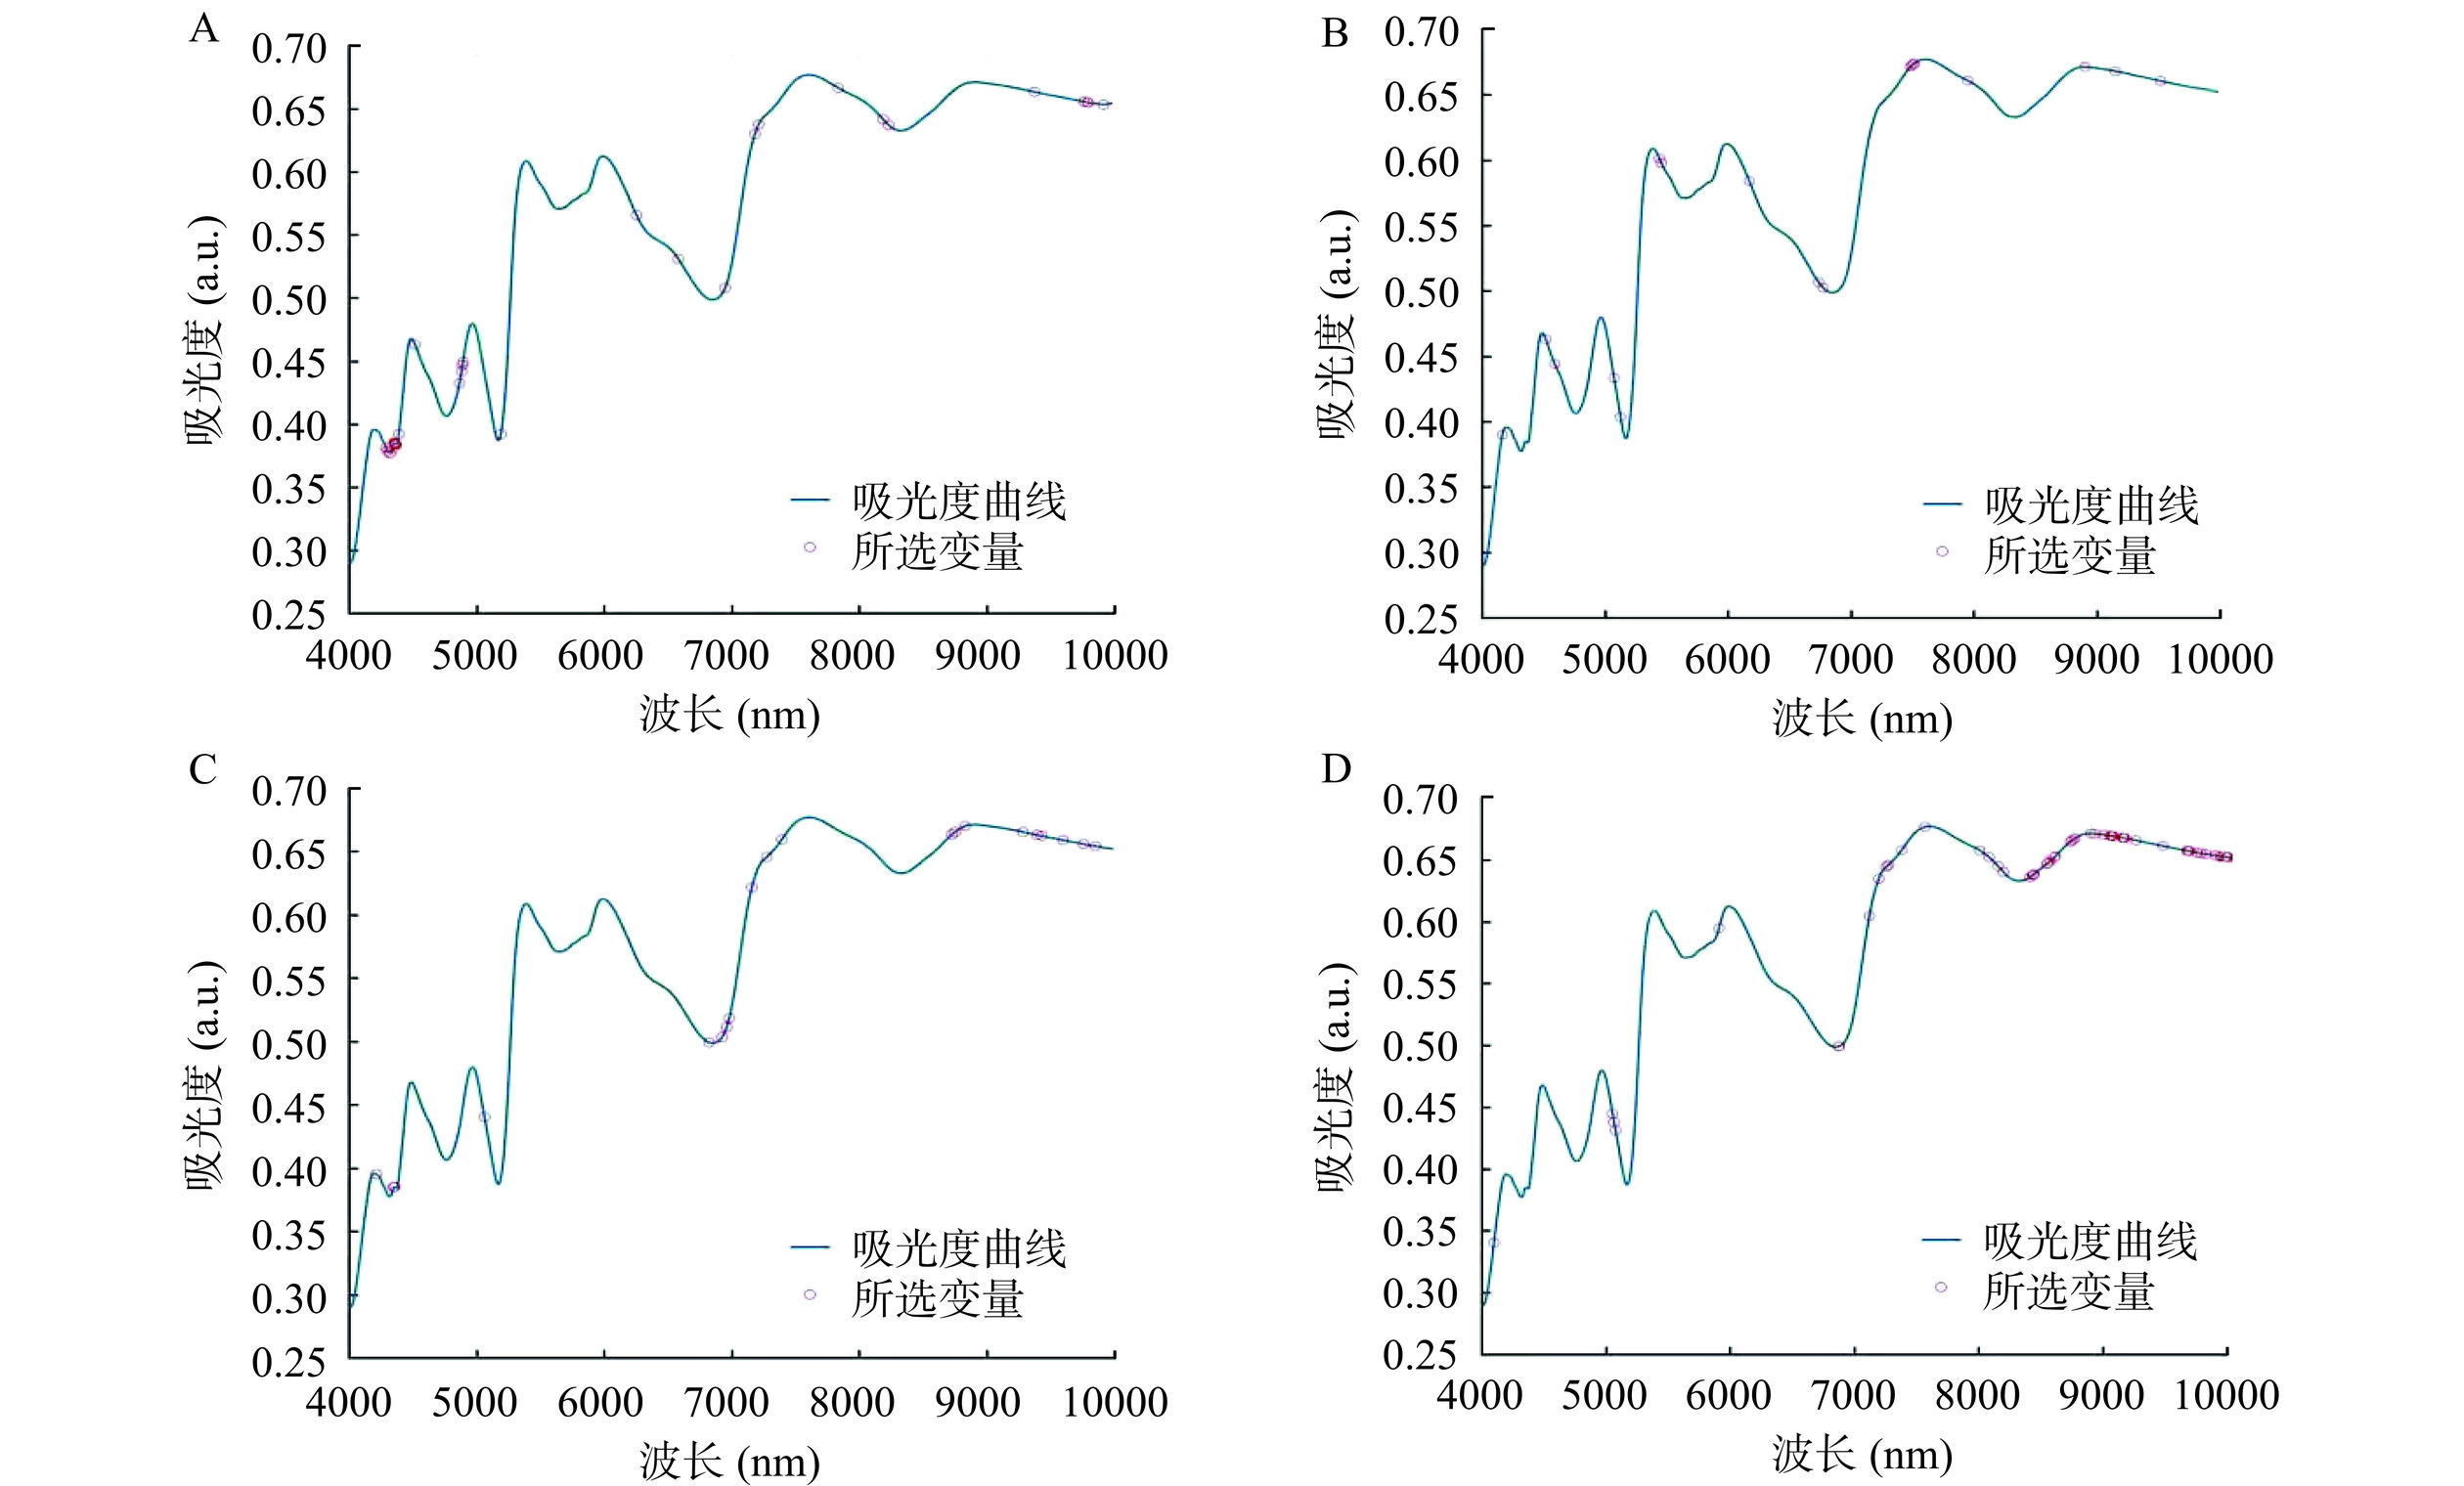
SPA算法以RMSECV的大小为依据确定特征波长数量。随着特征波长数量的增加,RMSECV的变化过程如图(图5A、图5B、图5C、图5D)所示。当波长数量由1增加到15(图5A)、1增加到5(图5B)、1增加到16(图5C)、1增加到18(图5D)时,RMSECV迅速下降,表明此类波长变量为青稞水分、β-葡聚糖、直链淀粉和蛋白质相关的重要波长变量。当波长数量由15增加到17(图5A)时,RMSECV呈波动式下降,此类波长为有用信息变量。随着波长数量的持续增加,RMSECV继续缓慢下降。因此以17、5、16、18个特征波长分别作为水分、β-葡聚糖、直链淀粉、蛋白质的特征变量。图6为特征波长在全光谱中的位置分布。
![]() 图 5 基于SPA的波长个数选择注:A. 水分;B. β-葡聚糖;C. 直链淀粉;D. 蛋白质。Figure 5. Wavelength selection based on SPA
图 5 基于SPA的波长个数选择注:A. 水分;B. β-葡聚糖;C. 直链淀粉;D. 蛋白质。Figure 5. Wavelength selection based on SPA![]() 图 6 基于SPA的特征波长选择注:A. 水分;B. β-葡聚糖;C. 直链淀粉;D. 蛋白质。Figure 6. Characteristic wavelength selection based on SPA
图 6 基于SPA的特征波长选择注:A. 水分;B. β-葡聚糖;C. 直链淀粉;D. 蛋白质。Figure 6. Characteristic wavelength selection based on SPA2.5.3 VCPA-IRIV筛选特征波长
VCPA-IRIV方法是一种新型的混合变量选择方法,将VCPA和IRIV相结合。通过VCPA算法来优化变量空间,解决了IRIV算法在变量数目较多时存在的局限性问题。VCPA-IRIV方法首先采用PLS计算每个子集的RMSECV,筛选出100个最优子集。随后,使用指数递减函数从这100个子集中消除所选较差的子集,经过50次迭代,最终得到100个变量子集。然后通过IRIV算法对100个子集进行进一步的筛选,消除没有贡献的信息变量,得到最优特征波长,最终选择了29、17、29、52个特征波长分别作为水分、β-葡聚糖、直链淀粉、蛋白质的特征变量,如图7所示。
![]() 图 7 基于VCPA-IRIV的特征波长选择注:A. 水分;B. β-葡聚糖;C. 直链淀粉;D. 蛋白质。Figure 7. Characteristic wavelength selection based on VCPA-IRIV
图 7 基于VCPA-IRIV的特征波长选择注:A. 水分;B. β-葡聚糖;C. 直链淀粉;D. 蛋白质。Figure 7. Characteristic wavelength selection based on VCPA-IRIV2.6 模型建立及评价
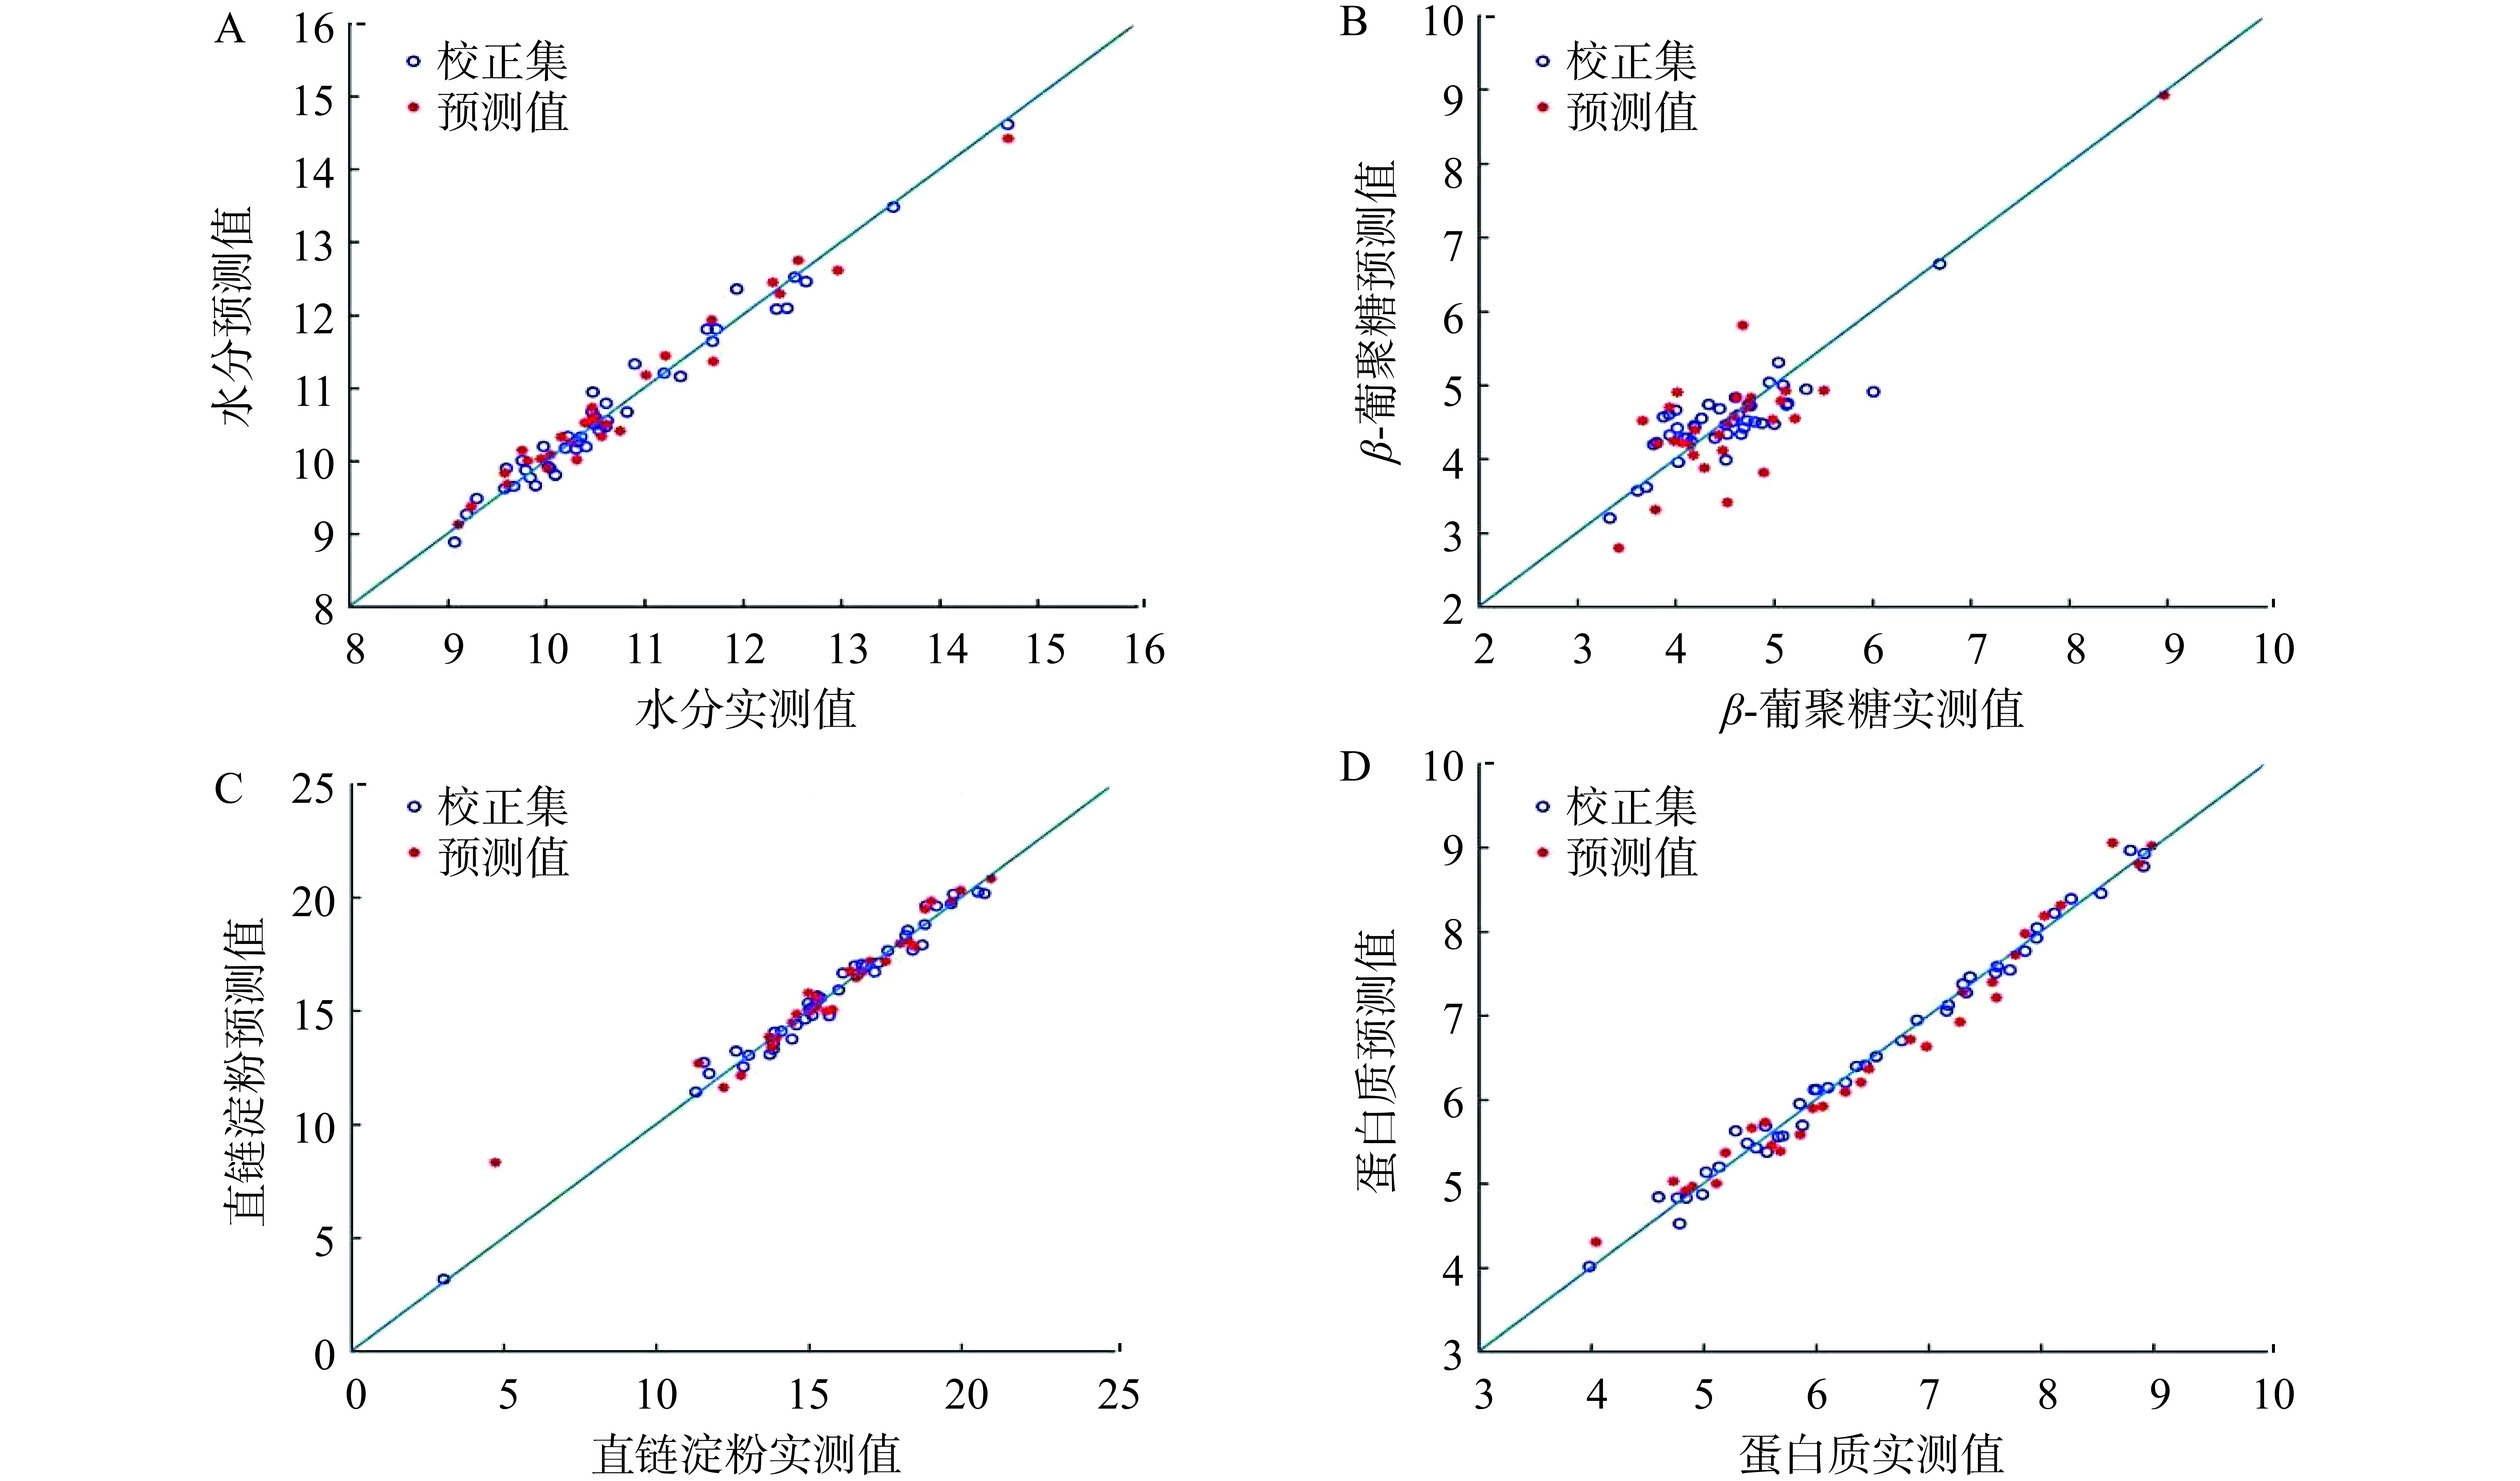
基于光谱预处理及CRAS、SPA和VCPA-IRIV特征波长筛选结果,应用PLS方法分别建立青稞水分、β-葡聚糖、直链淀粉和蛋白质的预测模型,结果见表4。由表4可知,与预处理相比,经过特征波长选择后,PLS模型的预测能力进一步提升。其中,水分、直链淀粉和蛋白质的VCPA-IRIV-PLS模型的性能最佳,Rc由0.9759、0.9854、0.9189上升到0.9864、0.9899、0.9957,Rp由0.9515、0.9369、0.8356上升到0.9868、0.9701、0.9879。β-葡聚糖的CARS-PLS模型性能最佳,Rc由0.9221上升到0.9544,Rp由0.9602上升到0.9808。图8直观展示出PLS预测模型对青稞水分、β-葡聚糖、直链淀粉和蛋白质含量的预测结果。相关系数高(大于0.90),预测均方根误差低,表明本研究所建立的PLS模型对青稞水分、β-葡聚糖、直链淀粉和蛋白质含量具有良好的预测能力。
表 4 不同波长提取方法的PLS模型结果比较Table 4. Comparison of PLS model results of different wavelength extraction methods参数 特征选择方法 变量个数 LVS Rc RMSEC Rp RMSEP 水分 Full spectrum 1501 10 0.9759 0.2547 0.9515 0.3914 CARS 29 10 0.9840 0.2079 0.9698 0.3021 SPA 17 10 0.9652 0.3049 0.9600 0.3485 VCPA-IRIV 29 10 0.9864 0.1919 0.9868 0.2042 β-葡聚糖 Full spectrum 1501 5 0.9221 0.2392 0.9602 0.4102 CARS 45 8 0.9544 0.1846 0.9808 0.1846 SPA 5 5 0.7373 0.4175 0.8358 0.5387 VCPA-IRIV 17 10 0.9498 0.2593 0.8536 0.3674
直链淀粉Full spectrum 1501 10 0.9854 0.5279 0.9369 1.1747 CARS 29 3 0.7336 2.1094 0.5913 2.5770 SPA 16 3 0.9287 1.1513 0.7361 2.1595 VCPA-IRIV 20 10 0.9899 0.4406 0.9701 0.8135 蛋白质 Full spectrum 1501 10 0.9189 0.5156 0.8356 0.7799 CARS 38 9 0.9676 0.3299 0.9472 0.4500 SPA 18 10 0.9245 0.4984 0.9120 0.5506 VCPA-IRIV 52 10 0.9957 0.1211 0.9879 0.2095 ![]() 图 8 预测模型对青稞水分、β-葡聚糖、直链淀粉和蛋白质含量的预测结果注:A. 水分VCPA-IRIV-PLS;B. β-葡聚糖CARS-PLS;C. 直链淀粉VCPA-IRIV-PLS;D. 蛋白质VCPA-IRIV-PLS。Figure 8. Prediction results of moisture, β-glucan, amylose and protein contents of highland barley by prediction model
图 8 预测模型对青稞水分、β-葡聚糖、直链淀粉和蛋白质含量的预测结果注:A. 水分VCPA-IRIV-PLS;B. β-葡聚糖CARS-PLS;C. 直链淀粉VCPA-IRIV-PLS;D. 蛋白质VCPA-IRIV-PLS。Figure 8. Prediction results of moisture, β-glucan, amylose and protein contents of highland barley by prediction model3. 结论
本研究利用近红外光谱技术,结合不同光谱预处理和特征波长筛选方法,构建并优化了青稞水分、β-葡聚糖、直链淀粉、蛋白质含量快速、准确检测模型。经光谱预处理和特征波长选择后,获得最优PLS模型,其校正集与测试集相关系数均超过0.90,表明预测能力优异。所测样本的水分、β-葡聚糖、直链淀粉和蛋白质含量主要分布在9%~12%、3%~5%、11%~20%、4%~8%之间,在该区间内模型预测能力较强,但在部分区域内的数据量较少,导致相关预测的准确性偏低,有待进一步优化。
综上所述,本研究所建立的模型能够准确快速测定大量青稞样品中水分、β-葡聚糖、直链淀粉及蛋白质的含量,极大提高了检测效率,模型的建立对加工企业原料品质质控及高效筛选提供了理论支撑。在后续研究中,还需进一步扩大样品来源,提高模型预测精度,同时建立对青稞中其它营养成分的预测方法。
-
![]()
图 1 青稞水分、直链淀粉、β-葡聚糖、蛋白质的实测含量
Figure 1. Measured contents of moisture, amylose, β-glucan and protein in highland barleys
![]()
图 2 青稞样本的马氏距离分布
Figure 2. Distribution of Mahalanobis distance of highland barley samples
![]()
图 3 不同方法对青稞近红外光谱预处理的结果
注:A. 原始光谱;B. SG卷积平滑;C. 标准正态变换(SNV);D. 多元散射校正(MSC);E. SG卷积平滑+MSC;F. MSC+SNV。
Figure 3. Results of near-infrared spectroscopy pretreatment of highland barleys by different methods
![]()
图 4 基于CARS的特征波长选择过程
注:A. 水分;B. β-葡聚糖;C. 直链淀粉;D. 蛋白质。
Figure 4. Characteristic wavelength selection process using CARS
![]()
图 5 基于SPA的波长个数选择
注:A. 水分;B. β-葡聚糖;C. 直链淀粉;D. 蛋白质。
Figure 5. Wavelength selection based on SPA
![]()
图 6 基于SPA的特征波长选择
注:A. 水分;B. β-葡聚糖;C. 直链淀粉;D. 蛋白质。
Figure 6. Characteristic wavelength selection based on SPA
![]()
图 7 基于VCPA-IRIV的特征波长选择
注:A. 水分;B. β-葡聚糖;C. 直链淀粉;D. 蛋白质。
Figure 7. Characteristic wavelength selection based on VCPA-IRIV
![]()
图 8 预测模型对青稞水分、β-葡聚糖、直链淀粉和蛋白质含量的预测结果
注:A. 水分VCPA-IRIV-PLS;B. β-葡聚糖CARS-PLS;C. 直链淀粉VCPA-IRIV-PLS;D. 蛋白质VCPA-IRIV-PLS。
Figure 8. Prediction results of moisture, β-glucan, amylose and protein contents of highland barley by prediction model
表 1 参试青稞信息
Table 1 Information of hulless highland barleys
编号 样品名称 产地 编号 样品名称 产地 编号 样品名称 产地 1 SS-1 西藏 27 SS-27 西藏 52 CDU-34(康青9号) 四川 2 SS-2 青海 28 SS-28 青海 53 CDU-35(藏青2000) 四川 3 SS-3 青海 29 SS-29 西藏 54 CDU-36(柴青1号) 青海 4 SS-4 西藏 30 SS-30 西藏 55 CDU-37 四川 5 SS-5 甘肃 31 SS-31 西藏 56 CDU-38 四川 6 SS-6 青海 32 SS-32 − 57 CDU-39 四川 7 SS-7 西藏 33 SS-33 − 58 CDU-40(昆仑14) 青海 8 SS-8 青海 34 SS-34 青海 59 CDU-41(昆仑15) 青海 9 SS-9 青海 35 SS-35 − 60 CDU-42(昆仑16) 青海 10 SS-10 西藏 36 SS-36 西藏 61 CDU-43(昆仑17) 青海 11 SS-11 西藏 37 SS-37 西藏 62 CDU-45 西藏 12 SS-12 西藏 38 CDU-14(AB-长青) 四川 63 CDU-47 青海 13 SS-13 西藏 39 CDU-15(黑六棱 ) 西藏 64 CDU-48 青海 14 SS-14 − 40 CDU-16 四川 65 CDU-49 青海 15 SS-15 西藏 41 CDU-17 西藏 66 CDU-50 青海 16 SS-16 西藏 42 CDU-18 西藏 67 CDU-51 青海 17 SS-17 青海 43 CDU-19(藏青2000) 西藏 68 CDU-52 青海 18 SS-18 甘肃 44 CDU-20(康青6号) 四川 69 CDU-53 青海 19 SS-19 青海 45 CDU-21(康青7号) 四川 70 CDU-54 青海 20 SS-20 西藏 46 CDU-22(康青9号) 四川 71 CDU-55 青海 21 SS-21 西藏 47 CDU-23 四川 72 CDU-56(藏青17) 西藏 22 SS-22 西藏 48 CDU-27(甘孜丹巴1号) 四川 73 CDU-57(藏青18) 西藏 23 SS-23 西藏 49 CDU-28(甘孜甲居1号) 四川 74 CDU-58(藏青320) 西藏 24 SS-24 西藏 50 CDU-29 四川 75 CDU-59 西藏 25 SS-25 − 51 CDU-33(肚里黄) 青海 76 CDU-60 西藏 26 SS-26 陕西 注:自主收集(CDU-),市售产品(SS-),−表示产地不明。  下载: 导出CSV
表 2 青稞籽粒近红外光谱样本集数据分布特征
Table 2 Distribution characteristics of near infrared spectrum sample set of highland barley grains
分类 指标 样品数 最大值(%) 最小值(%) 极差(%) 平均值(%) 标准
偏差变异系数 校正集 水分 43 14.69 9.07 5.62 10.77 1.18 0.11 β-葡聚糖 43 6.69 3.33 3.35 4.51 0.63 0.14 直链淀粉 43 20.76 3.03 17.72 15.66 3.14 0.2 蛋白质 43 8.92 3.99 4.94 6.6 1.3 0.05 预测集 水分 29 14.69 9.11 5.59 10.75 1.2 0.11 β-葡聚糖 29 8.97 3.42 5.54 4.6 0.98 0.21 直链淀粉 29 20.97 4.73 16.25 15.68 3.21 0.2 蛋白质 29 8.99 4.04 4.94 6.55 1.36 0.21 综合集 水分 72 14.69 9.07 5.63 10.77 1.18 0.11 β-葡聚糖 72 8.97 3.33 5.63 4.55 0.78 0.17 直链淀粉 72 20.97 3.03 17.94 15.67 3.14 0.2 蛋白质 72 8.99 3.99 5 6.54 1.33 0.2
下载: 导出CSV
表 3 不同预处理方法PLS模型结果比较
Table 3 Comparison of performance of PLS models with different pretreatment methods
参数 预处理方法 LVS Rc RMSEC Rp RMSEP 水分 None 2 0.4461 1.0442 0.3533 1.1699 SG卷积平滑 10 0.9759 0.2547 0.9515 0.3914 SNV 2 0.4333 1.0515 0.3591 1.1416 MSC 2 0.4313 1.0526 0.3576 1.1422 SG卷积平滑+MSC 2 0.5191 0.9972 0.4738 1.0919 MSC+SNV 3 0.4333 1.0515 0.3591 1.1416 β-葡聚糖 None 6 0.6134 0.4398 0.6358 0.8262 SG卷积平滑 6 0.9221 0.2392 0.9602 0.4102 SNV 10 0.8865 0.2859 0.7267 0.6919 MSC 10 0.8933 0.2777 0.4410 0.9289 SG卷积平滑+MSC 10 0.1075 0.6144 0.1252 0.9596 MSC+SNV 1 0.8865 0.2859 0.7267 0.6919 直链淀粉 None 4 0.8622 1.5725 0.6998 2.2868 SG卷积平滑 10 0.9854 0.5279 0.9369 1.1747 SNV 4 0.8862 1.4378 0.7424 2.1505 MSC 6 0.8876 1.4295 0.7440 2.1394 SG卷积平滑+MSC 4 0.7925 1.4733 0.6319 3.3824 MSC+SNV 2 0.8862 1.4378 0.7424 2.1505 蛋白质 None 1 0.2028 1.2800 0.3812 1.2603 SG卷积平滑 3 0.3284 1.2347 0.4529 1.1984 SNV 4 0.4169 1.1882 0.5566 1.1234 MSC 4 0.3624 1.2183 0.6774 1.0504 SG卷积平滑+MSC 4 0.9189 0.5156 0.8356 0.7799 MSC+SNV 10 0.4567 1.1688 0.4112 1.2171
下载: 导出CSV
表 4 不同波长提取方法的PLS模型结果比较
Table 4 Comparison of PLS model results of different wavelength extraction methods
参数 特征选择方法 变量个数 LVS Rc RMSEC Rp RMSEP 水分 Full spectrum 1501 10 0.9759 0.2547 0.9515 0.3914 CARS 29 10 0.9840 0.2079 0.9698 0.3021 SPA 17 10 0.9652 0.3049 0.9600 0.3485 VCPA-IRIV 29 10 0.9864 0.1919 0.9868 0.2042 β-葡聚糖 Full spectrum 1501 5 0.9221 0.2392 0.9602 0.4102 CARS 45 8 0.9544 0.1846 0.9808 0.1846 SPA 5 5 0.7373 0.4175 0.8358 0.5387 VCPA-IRIV 17 10 0.9498 0.2593 0.8536 0.3674
直链淀粉Full spectrum 1501 10 0.9854 0.5279 0.9369 1.1747 CARS 29 3 0.7336 2.1094 0.5913 2.5770 SPA 16 3 0.9287 1.1513 0.7361 2.1595 VCPA-IRIV 20 10 0.9899 0.4406 0.9701 0.8135 蛋白质 Full spectrum 1501 10 0.9189 0.5156 0.8356 0.7799 CARS 38 9 0.9676 0.3299 0.9472 0.4500 SPA 18 10 0.9245 0.4984 0.9120 0.5506 VCPA-IRIV 52 10 0.9957 0.1211 0.9879 0.2095
下载: 导出CSV
-
[1] 夏虎, 晏熙玥, 卢利聃, 等. 青稞的营养功能及其高值化利用研究进展[J]. 食品工业科技,2022,43(20):403−413. [XIA Hu, YAN Xiyue, LU Lidan, et al. Progress on nutritional function and high-value utilization of hulless barley[J]. Science and Technology of Food Industry,2022,43(20):403−413.] XIA Hu, YAN Xiyue, LU Lidan, et al. Progress on nutritional function and high-value utilization of hulless barley[J]. Science and Technology of Food Industry, 2022, 43(20): 403−413.
[2] 邓鹏, 张婷婷, 王勇, 等. 青稞的营养功能及加工应用的研究进展[J]. 中国食物与营养,2020,26(2):46−51. [DENG Peng, ZHANG Tingting, WANG Yong, et al. Research progress on nutritional function and processing application of highland barley[J]. Food and Nutrition in China,2020,26(2):46−51.] DENG Peng, ZHANG Tingting, WANG Yong, et al. Research progress on nutritional function and processing application of highland barley[J]. Food and Nutrition in China, 2020, 26(2): 46−51.
[3] 戎银秀. 青稞β-葡聚糖的制备、结构解析及其降血脂活性的研究[D]. 苏州:苏州大学, 2018. [RONG Yinxiu. Study on the preparation, structure analysis and hypolipidemic activity of β-glucan of highland barley[D]. Suzhou:Suzhou University, 2018.] RONG Yinxiu. Study on the preparation, structure analysis and hypolipidemic activity of β-glucan of highland barley[D]. Suzhou: Suzhou University, 2018.
[4] 胡辉, 刘鹏, 程佩佩, 等. 小分子青稞β-葡聚糖辅助降血糖功能研究[J]. 食品研究与开发,2018,39(21):33−37,99. [HU Hui, LIU Peng, CHENG Peipei, et al. Study on the auxiliary hypoglycemic function of small molecule β-glucan from hull-less barley[J]. Food Research and Development,2018,39(21):33−37,99.] HU Hui, LIU Peng, CHENG Peipei, et al. Study on the auxiliary hypoglycemic function of small molecule β-glucan from hull-less barley[J]. Food Research and Development, 2018, 39(21): 33−37,99.
[5] 阮玲丽, 邹青飞, 鲁朝凤, 等. 云南省不同粒色青稞色素提取工艺优化及其体外抗氧化活性[J]. 食品研究与开发,2022,43(6):40−49. [RUAN Lingli, ZOU Qingfei, LU Chaofeng, et al. Optimization of extraction technology and in vitro assessment of antioxidant activity of Yunnan highland barley pigments from different colored grains[J]. Food Research and Development,2022,43(6):40−49.] RUAN Lingli, ZOU Qingfei, LU Chaofeng, et al. Optimization of extraction technology and in vitro assessment of antioxidant activity of Yunnan highland barley pigments from different colored grains[J]. Food Research and Development, 2022, 43(6): 40−49.
[6] 仝海英, 王玉芬, 魏胜芳, 等. 高β-葡聚糖食品(青稞)对2型糖尿病糖代谢影响的研究[J]. 临床医药文献电子杂志,2016,3(57):11288−11289. [TONG Haiying, WANG Yufen, WEI Shengfang, et al. Study on the effect of high β-glucan food (highland barley) on glucose metabolism in type 2 diabetes[J]. Electronic Journal of Clinical Medical Literature,2016,3(57):11288−11289.] TONG Haiying, WANG Yufen, WEI Shengfang, et al. Study on the effect of high β-glucan food (highland barley) on glucose metabolism in type 2 diabetes[J]. Electronic Journal of Clinical Medical Literature, 2016, 3(57): 11288−11289.
[7] SOLOGUBIK C A, CAMPAONE L A, PAGANO A M, et al. Effect of moisture content on some physical properties of barley[J]. Industrial Crops & Products,2013,43:762−767.
[8] 侯殿志, 沈群. 我国29种青稞的营养及功能组分分析[J]. 中国食品学报,2020,20(2):289−298. [HOU Dianzhi, SHEN Qun. Analysis of nutrition and functional components of 29 kinds of highland barley in China[J]. Journal of Chinese Institute of Food Science and Technology,2020,20(2):289−298.] HOU Dianzhi, SHEN Qun. Analysis of nutrition and functional components of 29 kinds of highland barley in China[J]. Journal of Chinese Institute of Food Science and Technology, 2020, 20(2): 289−298.
[9] 陈晨, 何蒙蒙, 吴泽蓉, 等. 青稞β-葡聚糖的研究现状与展望[J]. 中国食品添加剂,2020,31(2):172−177. [CHEN Chen, HE Mengmeng, WU Zerong, et al. Research status and prospect of highland barley β-glucan[J]. China Food Additives,2020,31(2):172−177.] CHEN Chen, HE Mengmeng, WU Zerong, et al. Research status and prospect of highland barley β-glucan[J]. China Food Additives, 2020, 31(2): 172−177.
[10] 曹承嘉. 青稞抗性淀粉的制备及其对酒精性胃损伤的保护作用研究[D]. 上海:华东理工大学, 2020. [CAO Chengjia. Preparation of resistant starch in highland barley and its protective effect on alcohol-induced stomach injury[D]. Shanghai:East China University of Science and Technology, 2020.] CAO Chengjia. Preparation of resistant starch in highland barley and its protective effect on alcohol-induced stomach injury[D]. Shanghai: East China University of Science and Technology, 2020.
[11] 余飞, 邓丹雯, 董婧, 等. 直链淀粉含量的影响因素及其应用研究进展[J]. 食品科学,2007(10):604−608. [YU Fei, DENG Danwen, DONG Jing, et al. Influence factors of amylose content and its applied research progress[J]. Food Science,2007(10):604−608.] YU Fei, DENG Danwen, DONG Jing, et al. Influence factors of amylose content and its applied research progress[J]. Food Science, 2007(10): 604−608.
[12] 张伟建, 李茂, 赵佳伟, 等. 青稞酿造酒的研究进展[J]. 酿酒科技,2023,7:91−94. [ZHANG Weijian, LI Mao, ZHAO Jiawei, et al. Research progress in highland barley alcoholic drinks[J]. Liquor-Making Science & Technology,2023,7:91−94.] ZHANG Weijian, LI Mao, ZHAO Jiawei, et al. Research progress in highland barley alcoholic drinks[J]. Liquor-Making Science & Technology, 2023, 7: 91−94.
[13] 刘新红, 杨希娟, 吴昆仑, 等. 青稞品质特性及加工利用现状分析[J]. 农业机械,2013(14):49−53,49. [LIU Xinhong, YANG Xijuan, WU Kunlun, et al. Analysis of quality characteristics and processing and utilization status of highland barley[J]. Farm Machinery,2013(14):49−53,49.] LIU Xinhong, YANG Xijuan, WU Kunlun, et al. Analysis of quality characteristics and processing and utilization status of highland barley[J]. Farm Machinery, 2013(14): 49−53,49.
[14] 巨苗苗, 费希同, 林源, 等. 不同种源大麦籽粒功能成分及蛋白质含量变异分析[J]. 安徽农学通报,2014,20(17):39−40. [JU Miaomiao, FEI Xitong, LIN Yuan, et al. Analysis on variation of functional components and protein content of barley grains from different provenances[J]. Anhui Agricultural Science Bulletin,2014,20(17):39−40.] JU Miaomiao, FEI Xitong, LIN Yuan, et al. Analysis on variation of functional components and protein content of barley grains from different provenances[J]. Anhui Agricultural Science Bulletin, 2014, 20(17): 39−40.
[15] 高慧宇, 王国栋, 赵佳, 等. 近红外光谱测定小麦粉常规营养成分的模型优化[J]. 中国食物与营养,2021,27(5):30−34. [GAO Huiyu, WANG Guodong, ZHAO Jia, et al. Model optimization for determination of common nutritional components in wheat flour using near infrared spectroscopy[J]. Food and Nutrition in China,2021,27(5):30−34.] GAO Huiyu, WANG Guodong, ZHAO Jia, et al. Model optimization for determination of common nutritional components in wheat flour using near infrared spectroscopy[J]. Food and Nutrition in China, 2021, 27(5): 30−34.
[16] 陈海燕, 杨俊华, 谢荣国, 等. 宁夏玉米营养成分近红外分析模型建立与应用[J]. 畜牧兽医科学(电子版),2021(5):1−4,7. [CHEN Haiyan, YANG Junhua, XIE Rongguo, et al. Near infrared analysis of maize nutrient composition in Ningxia establishment and application of the model[J]. Graziery Veterinary Sciences (Electronic Version),2021(5):1−4,7.] CHEN Haiyan, YANG Junhua, XIE Rongguo, et al. Near infrared analysis of maize nutrient composition in Ningxia establishment and application of the model[J]. Graziery Veterinary Sciences (Electronic Version), 2021(5): 1−4,7.
[17] 黄林森, 刘冬, 覃统佳, 等. 近红外定量模型快速测定大米的营养成分[J]. 现代食品科技,2019,35(8):317−324,225. [HUANG Linsen, LIU Dong, QIN Tongjia, et al. Near infrared spectral quantitative model of the nutrient content in rice[J]. Modern Food Science and Technology,2019,35(8):317−324,225.] HUANG Linsen, LIU Dong, QIN Tongjia, et al. Near infrared spectral quantitative model of the nutrient content in rice[J]. Modern Food Science and Technology, 2019, 35(8): 317−324,225.
[18] 石振兴, 朱莹莹, 杨修仕, 等. 藜麦粉末中主要营养成分近红外预测模型的建立及验证[J]. 粮食与油脂, 2017, 30(12):55−57. [SHI Zhenxing, ZHU Yingying, YANG Xiushi, et al. Development of near-infrared reflectance spectroscopy (NIRS) predication model for the quality components of flour in quinoa[J]. Cereals & Oils, 2017, 30(12):55−57.] SHI Zhenxing, ZHU Yingying, YANG Xiushi, et al. Development of near-infrared reflectance spectroscopy (NIRS) predication model for the quality components of flour in quinoa[J]. Cereals & Oils, 2017, 30(12): 55−57.
[19] 刘墩福, 师成旭, 冯声宝, 等. 试剂盒法测定青海青稞酒中不同海拔高度青稞中β-葡聚糖含量[J]. 酿酒,2021,48(4):91−93. [LIU Dunfu, SHI Chengxu, FENG Shengbao, et al. Determination of β-glucan in highland barley wine at different altitude by reagent[J]. Liquor Making,2021,48(4):91−93.] LIU Dunfu, SHI Chengxu, FENG Shengbao, et al. Determination of β-glucan in highland barley wine at different altitude by reagent[J]. Liquor Making, 2021, 48(4): 91−93.
[20] LI Yangyang, HE Peilong, WANG Xiaowen, et al. FGW1, a protein containing DUF630 and DUF632 domains, regulates grain size and filling in oryza sativa L[J]. The Crop Journal,2023,11:1390−1400. doi: 10.1016/j.cj.2023.03.015
[21] JIANG Yongshun, CAO Sai, ZHOU Bin, et al. Hemocytes in blue mussel mytilus edulis adopt different energy supply modes to cope with different BDE-47 exposures[J]. Science of the Total Environment,2023,885:163766. doi: 10.1016/j.scitotenv.2023.163766
[22] TANG C, WANG P, ZHU X, et al. Acetylation of inorganic pyrophosphatase by S-RNase signaling induces pollen tube tip swelling by repressing pectin methylesterase[J]. Plant Cell,2023,35(9):3544−3565. doi: 10.1093/plcell/koad162
[23] 章盛, 李栓, 李栋, 等. 辊压法烟草薄片在线检测模型建立与验证[J]. 黑龙江造纸,2021,49(4):14−18. [ZHANG Sheng, LI Shuan, LI Dong, et al. Establishment and verification of on-line detection model of rolled tobacco sheet[J]. Heilongjiang Pulp & Paper,2021,49(4):14−18.] ZHANG Sheng, LI Shuan, LI Dong, et al. Establishment and verification of on-line detection model of rolled tobacco sheet[J]. Heilongjiang Pulp & Paper, 2021, 49(4): 14−18.
[24] 张旭, 白雪冰, 汪学沛, 等. 近红外特征光谱的羊肉TVB-N浓度预测模型[J]. 光谱学与光谱分析,2021,41(11):3377−3384. [ZHANG Xu, BAI Xuebing, WANG Xuepei, et al. Prediction model of TVB-N concentration in mutton based on near infrared characteristic spectra[J]. Spectroscopy and Spectral Analysis,2021,41(11):3377−3384.] ZHANG Xu, BAI Xuebing, WANG Xuepei, et al. Prediction model of TVB-N concentration in mutton based on near infrared characteristic spectra[J]. Spectroscopy and Spectral Analysis, 2021, 41(11): 3377−3384.
[25] 李江波, 郭志明, 黄文倩, 等. 应用CARS和SPA算法对草莓SSC含量NIR光谱预测模型中变量及样本筛选[J]. 光谱学与光谱分析,2015,35(2):372−378. [LI Jiangbo, GUO Zhiming, HUANG Wenqian, et al. Near-infrared spectra combining with CARS and SPA algorithms to screen the variables and samples for quantitatively determining the soluble solids content in strawberry[J]. Spectroscopy and Spectral Analysis,2015,35(2):372−378.] LI Jiangbo, GUO Zhiming, HUANG Wenqian, et al. Near-infrared spectra combining with CARS and SPA algorithms to screen the variables and samples for quantitatively determining the soluble solids content in strawberry[J]. Spectroscopy and Spectral Analysis, 2015, 35(2): 372−378.
[26] LIU Lihua, ZAREEF Muhammad, WANG zhen, et al. Monitoring chlorophyll changes during Tencha processing using portable near-infrared spectroscopy[J]. Food chemistry,2023,412:135505. doi: 10.1016/j.foodchem.2023.135505
[27] 王动民, 纪俊敏, 高洪智. 多元散射校正预处理波段对近红外光谱定标模型的影响[J]. 光谱学与光谱分析, 2014, 34(9):2387−2390. [WANG Dongmin, JI Junmin, GAO Zhihong, The effect of MSC spectral pretreatment regions on near infrared spectroscopy calibration results[J]. Spectroscopy and Spectral Analysis, 2014, 34(9):2387−2390.] WANG Dongmin, JI Junmin, GAO Zhihong, The effect of MSC spectral pretreatment regions on near infrared spectroscopy calibration results[J]. Spectroscopy and Spectral Analysis, 2014, 34(9): 2387−2390.
[28] 王胜鹏, 龚自明, 郑鹏程, 等. 青砖茶品质近红外特征光谱筛选及预测模型建立[J]. 食品科学,2020,41(18):283−287. [WANG Shengpeng, GONG Ziming, ZHENG Pengcheng, et al. Selection of characteristic near infrared spectra and establishment of prediction model for qingzhuan tea quality[J]. Food Science,2020,41(18):283−287.] WANG Shengpeng, GONG Ziming, ZHENG Pengcheng, et al. Selection of characteristic near infrared spectra and establishment of prediction model for qingzhuan tea quality[J]. Food Science, 2020, 41(18): 283−287.
[29] 白京, 李家鹏, 邹昊, 等. 近红外特征光谱定量检测羊肉卷中猪肉掺假比例[J]. 食品科学,2019,40(2):287−292. [BAI Jing, LI Jiapeng, ZOU Hao, et al. Quantitative detection of pork in adulterated mutton rolls based on near infrared spectroscopy[J]. Food Science,2019,40(2):287−292.] BAI Jing, LI Jiapeng, ZOU Hao, et al. Quantitative detection of pork in adulterated mutton rolls based on near infrared spectroscopy[J]. Food Science, 2019, 40(2): 287−292.
[30] 朱向荣, 李娜, 史新元, 等. 近红外光谱与组合的间隔偏最小二乘法测定清开灵四混液中总氮和栀子苷的含量[J]. 高等学校化学学报,2008(5):906−911. [ZHU Xiangrong, LI Na, SHI Xinyuan, et al. Determination of total nitrogen and gardeniside in Qingkailing mixture by near infrared spectroscopy and combined interval partial least square method[J]. Chemical Journal of Chinese Universities,2008(5):906−911.] ZHU Xiangrong, LI Na, SHI Xinyuan, et al. Determination of total nitrogen and gardeniside in Qingkailing mixture by near infrared spectroscopy and combined interval partial least square method[J]. Chemical Journal of Chinese Universities, 2008(5): 906−911.
[31] LI Hongdong, LIANG Yizeng, XU Qinsong, et al. Key wavelengths screening using competitive adaptive reweighted sampling method for multivariate calibration[J]. Analytica Chimica Acta,2009,648(1):77−84. doi: 10.1016/j.aca.2009.06.046
[32] 李颖, 陈元胜, 吕靓, 等. 基于近红外特征变量筛选对火麻油掺杂的快速检测[J]. 福州大学学报(自然科学版),2018,46(4):574−579. [LI Ying, CHEN Yuansheng, LÜ Liang, et al. Fast detecting the adulteration of hemp seed oil based on characteristic variables optimization of NIR spectroscopy[J]. Journal of Fuzhou University (Natural Science Edition),2018,46(4):574−579.] LI Ying, CHEN Yuansheng, LÜ Liang, et al. Fast detecting the adulteration of hemp seed oil based on characteristic variables optimization of NIR spectroscopy[J]. Journal of Fuzhou University (Natural Science Edition), 2018, 46(4): 574−579.
[33] 张华秀, 李晓宁, 范伟, 等. 近红外光谱结合CARS变量筛选方法用于液态奶中蛋白质与脂肪含量的测定[J]. 分析测试学报,2010,29(5):430−434. [ZHANG Huaxiu, LI Xiaoning, FAN Wei, et al. Determination of protein and fat in liquid milk by NIR combined with CARS variables screening method[J]. Journal of Instrumental Analysis,2010,29(5):430−434.] ZHANG Huaxiu, LI Xiaoning, FAN Wei, et al. Determination of protein and fat in liquid milk by NIR combined with CARS variables screening method[J]. Journal of Instrumental Analysis, 2010, 29(5): 430−434.
[34] YANG C, MA X D, GUAN H O, et al. A rapid recognition method of auricularia auricula varieties based on Near infrared spectral characteristics[J]. Infrared Physics & Technology,2022,125:104239.
[35] 许文丽, 药林桃, 孙通, 等. 基于CARS-SPA的苹果可溶性固形物可见/近红外光谱在线检测[J]. 食品工业科技,2014,35(22):61−64. [XU Wenli, YAO Lintao, SUN Tong, et al. CARS-SPA baesd visble/near infraed spectroscopy on-line detection of apple soluble solids content[J]. Science and Technology of Food Industry,2014,35(22):61−64.] XU Wenli, YAO Lintao, SUN Tong, et al. CARS-SPA baesd visble/near infraed spectroscopy on-line detection of apple soluble solids content[J]. Science and Technology of Food Industry, 2014, 35(22): 61−64.
[36] 穆炳宇. 基于近红外光谱技术的鲜切花椰菜品质检测研究[D]. 太原:山西农业大学, 2022. [MU Bingyu. Study on quality detection of fresh-cut cauliflower based on near infrared spectroscopy[D]. Taiyuan:Shanxi Agricultural University, 2022.] MU Bingyu. Study on quality detection of fresh-cut cauliflower based on near infrared spectroscopy[D]. Taiyuan: Shanxi Agricultural University, 2022.
[37] 张付杰, 史磊, 李丽霞, 等. 高光谱成像的三七粉质量等级无损鉴别[J]. 光谱学与光谱分析,2022,42(7):2255−2261. [ZHANG Fujie, SHI Lei, LI Lixia, et al. Study on nondestructive identification of panax notoginseng powder quality grade based on hyperspectral imaging technology[J]. Spectroscopy and Spectral Analysis,2022,42(7):2255−2261.] ZHANG Fujie, SHI Lei, LI Lixia, et al. Study on nondestructive identification of panax notoginseng powder quality grade based on hyperspectral imaging technology[J]. Spectroscopy and Spectral Analysis, 2022, 42(7): 2255−2261.
-
期刊类型引用(2)
1. 曹诗佳,梁栋,朱瑶迪,赵莉君,李苗云,孙灵霞,赵改名,柳艳霞. 基于高光谱成像技术快速检测酸肉发酵过程中酸含量的动态变化. 食品安全质量检测学报. 2025(02): 187-195 .  百度学术
百度学术
2. 宋烨,郑晓冬,闫新焕,刘雪梅,周大森,范艺璇,吴茂玉. 数字化果蔬质量透明工程助力果蔬产业发展的思考与建议. 中国果菜. 2024(11): 1-6+28 . 百度学术
其他类型引用(2)
 下载:
下载:


计量
- 文章访问数: 0
- HTML全文浏览量: 0
- PDF下载量: 0
- 被引次数: 4
