Effect of Soaking Time on the Quality of Soymilk and Their Correlation Analysis
-
摘要: 研究大豆浸泡时间(6、8、10、12、14、16 h)对豆浆理化特性和感官品质的影响,为大豆浸泡时间的选择提供理论支撑。实验以大豆水分含量及分布、可溶性蛋白质含量、固形物含量、粒径、黏度、稳定性及感官评分作为考察指标,分析浸泡时间对豆浆品质的影响并确定大豆适宜的浸泡时长;采用Pearson相关系数对浸泡时间、大豆水分组成与豆浆品质的关系进行分析。低场核磁共振结果表明,T21、T22、T23信号值随着浸泡时间延长而升高,大豆吸附水的占比增加,大豆浸泡12 h后水分达到饱和状态。豆浆的品质研究结果表明,随着浸泡时间的延长,豆浆的蛋白质转移率、体积平均粒径、黏度均呈现先升高后降低的趋势,总固形物含量显著降低(P<0.05),豆浆稳定性先降低后升高;豆浆的感官评分值随着大豆浸泡时间的增加先增加后降低,8 h豆浆的感官综合评价值最高为1.0466,其次是10 h的豆浆。基于以上结果,优选大豆浸泡时间为8 h,虽然该时间的豆浆黏度低,口感浓度评分低,亮度值低;但是其可溶性蛋白质含量最高,为0.905 g/100 g,蛋白转移率可达到16.61%;总固形物含量仅次于6 h的豆浆,含量为3.185 g/100 g;而且色差b值最低,感官综合评价值最高。相关性分析结果表明:浸泡时间与大豆结合水占比、自由水占比呈显著负相关,与吸附水占比呈显著正相关(r=−0.9638、−0.8241、0.9391);豆浆的品质指标受到浸泡时间影响,其中浸泡时间与豆浆可溶性蛋白质、总固形物含量、L值呈显著负相关,与a值呈显著正相关关系(r=−0.9122、−0.9726、−0.8238、0.9385)。Abstract: The effects of soybean soaking time (6, 8, 10, 12, 14, 16 h) on the physicochemical properties and sensory quality of soymilk were studied, which provided theoretical support for the selection of soybean soaking time. Soybean moisture content and distribution, soluble protein content, solid content, particle size, viscosity, stability and sensory score were used as indicators to analyze the influence of soaking time on the quality of soymilk and determine the optimal soaking time of soybean. The relationships between soaking time, soybean moisture composition and soymilk quality were analyzed by using the Pearson's correlation method. The results of low-field NMR showed that with the increase of soaking time, the signal values of T21, T22 and T23 increased, and the proportion of adsorbed water increased. The soybean moisture reached saturation after 12 h soaking. The results of the quality study showed that with the increase of soaking time, the protein transfer rate, the average particle size at volume and viscosity of soymilk had a trend of increasing first and then decreasing. The total solids content decreased significantly (P<0.05), and soymilk stability decreased first and then increased. The sensory comprehensive score first increased and then decreased, with the highest score of 1.0466 after 8 h soaking, followed by 10 h soaking. Based on the above results, 8 h was chosen as the best soaking time for soybeans to make soymilk. Despite the viscosity, the taste score and the brightness value were low after 8 h soaking, the soluble protein content was the highest, which was 0.905 g/100 g, and the protein transfer rate reached 16.61%. The total solids content was 3.185 g/100 g after 8 h soaking, which was second only to 6 h of soaking. Meanwhile, b value was the lowest, and the sensory comprehensive evaluation value was the highest after 8 h soaking. The correlation analysis results showed that the soaking time was significantly negatively correlated with the proportion of soybean bound water and free water, and significantly positively correlated with the proportion of adsorbed water (r=−0.9638, −0.8241, 0.9391). The quality index of soymilk was affected by the soaking time, which was significantly negatively correlated with the soluble protein, the total solids content and the L value, and significantly positively correlated with a value (r=−0.9122, −0.9726, −0.8238, 0.9385).
-
Keywords:
- soymilk quality /
- soybean soaking time /
- soymilk particle size /
- stability /
- sensory evaluation /
- correlation
-
大豆经过浸泡、磨浆、过滤、煮制后,大豆的蛋白质颗粒、脂质颗粒和其他可溶性物质悬浮在提取液中,形成一种复杂的胶体体系——豆浆[1−2]。浸泡工艺是豆浆生产中的一个重要环节,影响大豆吸水程度、软硬度和豆浆、豆腐等豆制品的品质[3]。浸泡过程中,大豆发生结构和营养物质上的变化,其吸水程度直接影响大豆质地和加工过程中的研磨特性[4]。大豆浸泡是缓慢的过程,浸泡时间一般是春夏5~8 h,秋冬12~15 h[5]。浸泡决定豆浆的色泽、颗粒大小等品质[3,6],合适的浸泡时间,有利于大豆组织结构软化[4],磨浆时生产细腻的乳液,提升豆浆的品质。
豆浆的可溶性蛋白质含量、可溶性固形物含量、固形物含量、稳定性、感官评分等是衡量豆浆品质的重要指标[7]。浸泡过程中,随着大豆吸水量的增大,大豆种皮结构变得松散,大豆籽粒空隙增大[8],这有利于磨浆过程中蛋白体的破碎及蛋白质的充分溶出,提高豆浆的蛋白质利用率及豆浆得率[5]。但是可溶性蛋白质、水溶性色素、糖类会在浓度差的作用下释放到浸泡液中[3],过长的浸泡时间会导致豆浆中可溶性物质的损失[9];长时间的浸泡还容易引起细菌滋生。崔亚丽等[10]研究表明浸泡处理后制作的豆浆粒径小于干豆豆浆,且能提高蛋白含量和蛋白回收率。豆浆的稳定性是豆浆品质的重要评价指标[11],它同样影响着豆浆的营养品质,对豆浆的口感品质、储藏能力也有一定的影响[12]。
目前人们多选择感官评价、营养物质含量作为评价标准[3,13−14],考虑大豆浸泡的时间、温度、pH等因素对豆浆品质的影响,以此来选择最佳品质的豆浆。Li等[3]已研究发现虽然高温可以减少大豆浸泡时间,但不利于脂肪、蛋白质和固体物的提取,对豆浆的白度值和粒径等也有不利影响。杨蕊莲[15]以稳定性、蛋白质含量、感官评价为指标确定了豆浆最佳制作工艺:浸泡豆水比1:3、浸泡10 h、磨浆豆水比1:9、煮浆温度95 ℃维持9 min。但对于大豆超过6 h后的浸泡时间对豆浆营养成分、理化特性的内在规律影响及关系仍然未被解答。因此本实验在研究6~16 h浸泡过程中豆浆的可溶性蛋白质、固形物含量、蛋白质转移率、稳定性、黏度、粒径、色差等指标的基础上,探讨大豆不同浸泡时间对豆浆理化特性和感官品质的影响,揭示大豆浸泡时间与理化特性和感官品质之间的关系,为豆浆加工中浸泡时间的合理选择提供参考。
1. 材料与方法
1.1 材料与仪器
大豆 九研13,蛋白质含量43.7%(干基)、脂肪含量10.13%(干基)、水分含量16.4%(干基),黑河市嫩江县建边农场种子公司;考马斯亮蓝G250 Biosharp生物公司;石油醚(60~80 ℃) 辽宁泉瑞试剂有限公司。
GHP-9160隔水式恒温培养箱 上海一恒科学仪器有限公司;普通150型单相多功能电动磨浆机 沧州铁狮磨浆机械有限公司;DK-98-ⅡA电热恒温水浴锅 天津市泰斯特仪器有限公司;SP-722E型可见分光光度计 上海嘉鹏科技有限公司;NMI20-Analyst低场核磁共振分析仪 苏州(上海)纽迈电子科技有限公司;L-420型低速台式离心机 湖南湘仪实验室仪器开发有限公司;2WAJ阿贝折射仪 上海申光仪器仪表有限公司;DGG-9140电热恒温鼓风干燥箱 上海森信实验仪器有限公司;Brookfiled DV-III流变仪黏度计 美国Brookfield公司;Bettersize 2000激光粒度分布仪 丹东市百特仪器有限公司;CR-410色差计 Konica Minolta公司。
1.2 实验方法
1.2.1 大豆的浸泡及T2弛豫时间测定
清洗原料大豆后,以1:3(m:m)的豆水比于25 ℃下浸泡处理。取6、8、10、12、14、16 h浸泡后的大豆擦干并用防水纸包裹,存于4 ℃冰箱在4 h内完成测定。
使用LF-NMR进行质子弛豫时间测量,观察大豆浸泡过程中的水分迁移。将包好的样品置于磁体中心位置,使用CMPG脉冲序列测定横向弛豫时间(T2),参数设置:中心频率SF=19 MHz,90°脉冲宽度P1=20 µs,180°脉冲宽度P2=30 µs,频率宽度SW=100 kHz,信号采样数TD=164996,重复扫描次数NS=16,回波个数NECH=5000。待扫描结束后,利用反演软件对采集的信号进行拟合得到T2谱图[16],对每个特征峰的弛豫时间以及对应峰面积进行分析计算。
1.2.2 豆浆的制作
准确称取浸泡后的大豆50.00 g,以1:9的豆水比磨浆2 min,使用100目尼龙网袋过滤,95 ℃煮浆20 min。迅速冷却至室温,于4 ℃保存。
1.2.3 豆浆营养成分的测定
1.2.3.1 豆浆可溶性蛋白质含量的测定
使用考马斯亮蓝染色法[17]进行测定。蛋白质转移率[6]计算如下:
豆浆蛋白质转移率(%)=V×X1M×X2×100 (1) 式中:V为豆浆体积,mL;X1为豆浆可溶性蛋白质含量,g/100 mL;M为原料大豆质量,g;X2为原料大豆蛋白质含量,g/100 g。
1.2.3.2 可溶性固形物含量的测定
使用数显折射仪[18]进行测定。
1.2.3.3 总固形物含量的测定
总固形物含量使用冻干法[19]进行测定,冻干时间为24 h。
1.2.4 豆浆理化特性的测定
1.2.4.1 颗粒粒径分布
使用激光粒度仪进行测定,参数控制见文献[11,20]:分散剂去离子水的折射率为1.333,分散相豆浆的折射率为1.560,加样过程及测定过程使用超声进行样品的分散处理,并且测定过程前进行1 min的超声处理。遮光度达到10%后进行测定。
1.2.4.2 黏度
使用黏度计[21]测定。Brookfield黏度计使用61号转子,转速为100 r/min,测定温度为25 ℃。测定时间为3 min,每30 s测定一次,测定三次取平均值。
1.2.4.3 稳定性
采用稳定性系数法测定,取2 mL豆浆稀释至50 mL,于4000 r/min离心5 min后取上清液。在785 nm下分别测定样品离心前后的吸光值。计算如下:R值越大表明豆浆稳定性越好[18]。
R=A2A1 (2) 式中:R为稳定性系数;A1为离心前吸光值;A2为离心后吸光值。
1.2.4.4 色差
豆浆于250 mL的透明塑料瓶中测定色差值(L:明亮度,+白,−黑;a:红绿值,+红,−绿;b:黄蓝值,+黄,−蓝)。测定前使用白色参考板和黑色参考板较零,每组样品测定三次。
1.2.5 感官评价
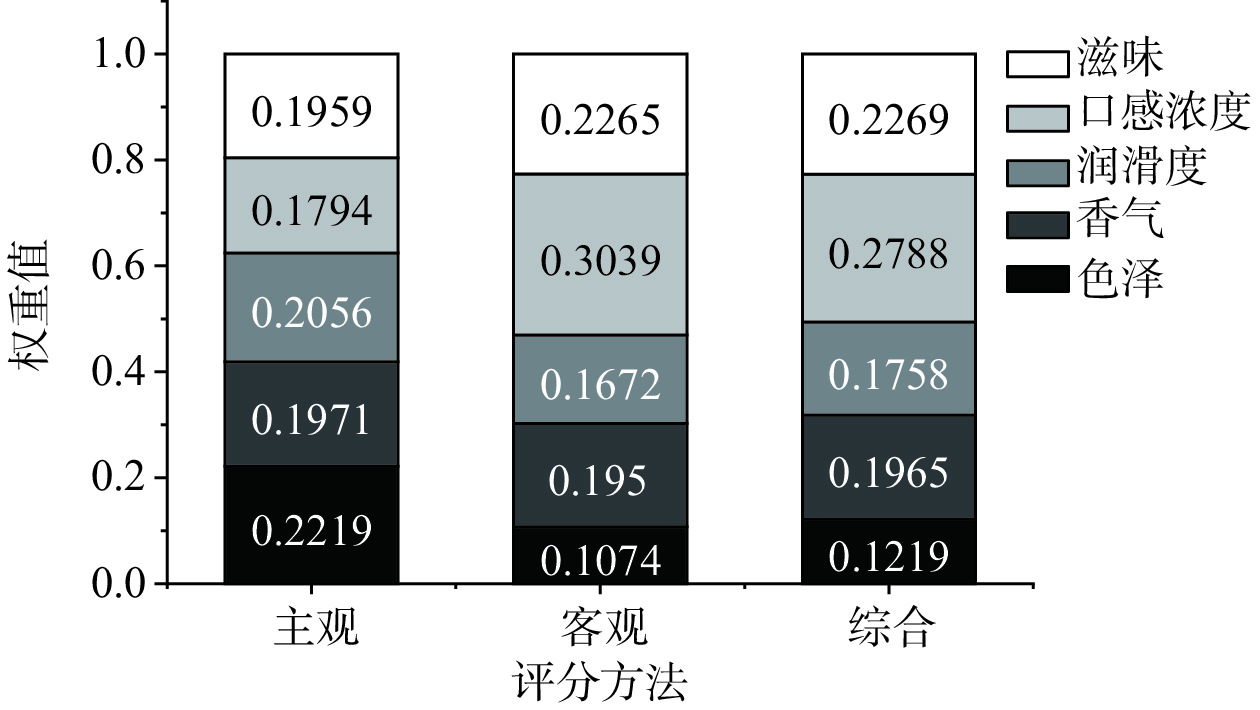
感官评价小组由10名食品专业研究生组成,对豆浆具有一定的辨识度及记忆力。豆浆样品从4 ℃冰箱取出后,30 ℃水浴30 min后进行感官评价。豆浆的色泽、香气、润滑度、口感浓度、滋味作为感官评价指标,感官评分的计算参考陈聪[22]的方法。采用组合赋权法确定五项指标的权重值,归一化处理专家评分的平均值为主观权重值;归一化处理评分的变异系数平均值为客观权重值;两个方法乘积结果归一化处理后得到最终权重值。采用线性综合法、几何综合法和混合综合法计算豆浆的综合评分,用均值法对各指标无量纲化,计算各指标的线性综合值(权重值和无量纲值的乘积的和)、几何综合值(无量纲值积分的乘积)和综合评分值(50%线性综合值和50%几何综合值的和)。每位专家对样品所有指标的评分标准偏差都在0.02(<0.02)范围内。
1.3 数据处理
实验均重复三次,计算其平均值。采用Excel 2010、SPSS 22、Origin Pro 2021进行数据分析及图表绘制。相关性分析使用Origin Pro 2021中的Correlation Plot进行绘图,分析相关类型为Person相关。
2. 结果与分析
2.1 浸泡过程大豆水分的变化
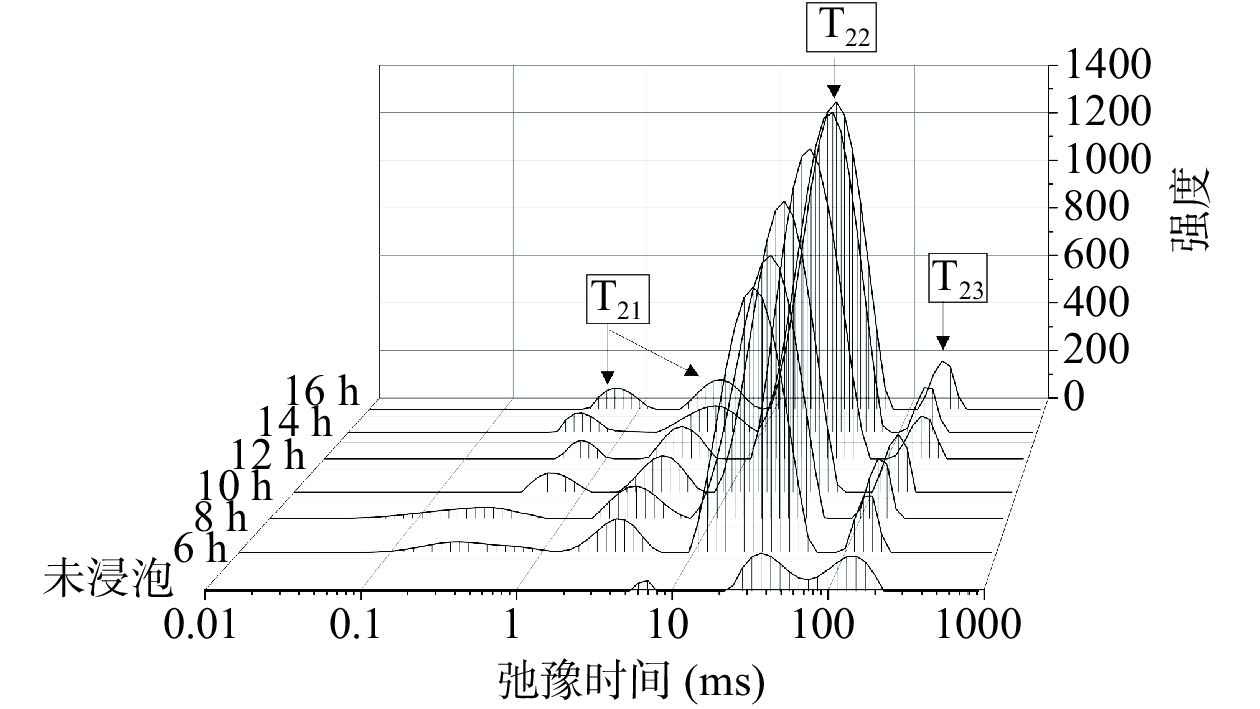
如图1所示,大豆经过不同浸泡时间处理后T2弛豫曲线均有三个峰,通过弛豫时间的不同将其分为:T21(0~10 ms)为结合水,T22(10~100 ms)为吸附水,T23(100~1000 ms)为自由水[23]。随着浸泡时间的延长,曲线整体向右移动,表明大豆种子内水分自由度增加,流动性增强。T21、T22、T23信号值都随着浸泡时间延长而增高,其中T22信号值增加最明显,表明在25 ℃环境的浸泡过程中,大豆种子内水分含量的增加主要是吸附水含量增加导致的[16]。T21、T22峰顶点时间随着浸泡时间延长出现右移趋势,表明大豆在25 ℃浸泡过程中水分自由度逐渐增大,水的流动性增强,水与大分子物质的结合能力逐渐减弱[24]。浸泡时间超过10 h后,T21峰顶点时间变化范围小,表明大豆内部结合水的波动范围小,呈稳定状态。
如表1所示,M21、M22、M23分别表示T21、T22、T23所占的比例。浸泡时间6 h时,M22已达到80%以上,说明浸泡6 h时的大豆中的水主要以吸附水为主(未浸泡处理的大豆中结合水、吸附水、自由水所占比例分别为:4.62%、50.76%、43.85%)。滕文静[23]研究1~6 h浸泡过程大豆的T2弛豫曲线,发现刚开始浸泡时大豆以结合水居多,随时间的增加,吸附水逐步变多,然后由吸附水转向自由水。12、14、16 h的峰面积比例M21、M22、M23之间显著性差异不显著(P>0.05),表明25 ℃浸泡12 h的大豆内部水分接近饱和,水分子与大豆内部大分子之间的质子转换达到相对稳定的状态。Lima等[17]发现在25 ℃下浸泡7 h大豆能够达到水分含量120%(以干基计),这是大豆研磨过程之前建议的最低水分含量,超过7 h后硬度的变化不会受到浸泡时间的影响。Li等[3]研究发现大豆浸泡可达到的最大吸水率为130%(以干基计),在25 ℃下浸泡12 h左右已达到最大吸水率,且与Peleg预测模型一致。因此可以确定25 ℃环境下12 h的浸泡时间,大豆吸水达到饱和。
表 1 浸泡过程大豆各类水分组成的峰面积占比Table 1. Proportion of peak area of various water components during soybean soaking浸泡时间(h) M21(%) M22(%) M23(%) 6 12.00±0.55a 81.78±0.93c 6.22±0.59ab 8 10.88±1.46ab 82.52±1.47bc 6.60±0.47a 10 10.53±1.17bc 84.11±1.65b 5.33±0.83bc 12 9.54±1.28bcd 86.05±1.20a 4.41±1.31c 14 9.02±0.59cd 86.34±0.45a 4.64±0.84c 16 9.08±0.45d 86.09±0.83a 4.83±0.46c 注:表中同一列不同小写字母表示具有显著性差异(P<0.05),表2同。 2.2 大豆浸泡时间对豆浆可溶性蛋白质含量的影响
可溶性蛋白质是大豆蛋白质亚基的单体或寡聚体[25],豆浆中可溶性蛋白质来源于磨浆时的蛋白质和从大豆蛋白体中新解离的可溶性蛋白质,因此可溶性蛋白质的含量可以表征豆浆对原料蛋白质利用程度。由图2可知,可溶性蛋白质含量排序为:8 h>10 h>6 h>12 h>14 h>16 h;随着浸泡时间的延长,蛋白质转移率呈现先升高后降低的趋势。6 h豆浆可溶性蛋白质含量低于8和10 h豆浆,且其蛋白质转移率显著低于其他豆浆(P<0.05),说明6 h的浸泡处理大豆的蛋白质利用率低,蛋白质损失在豆渣中,因此大豆浸泡6 h不建议作为制作豆浆前的浸泡时间。大豆浸泡时间超过10 h后可溶性蛋白质含量显著降低(P<0.05),原因是随着浸泡时间增长大豆组织细胞间空隙增大,浸泡液中7S蛋白和11S蛋白因浓度差的作用释放,且浸泡时间越长蛋白质损失越多[3];另一方面,浸泡时间越长,大豆含水量越高[26],可溶性蛋白质含量越低,因此豆浆中提取的可溶性蛋白质含量越低,这也是10 h后蛋白质转移率缓慢降低的原因。
2.3 大豆浸泡时间对豆浆固形物含量的影响
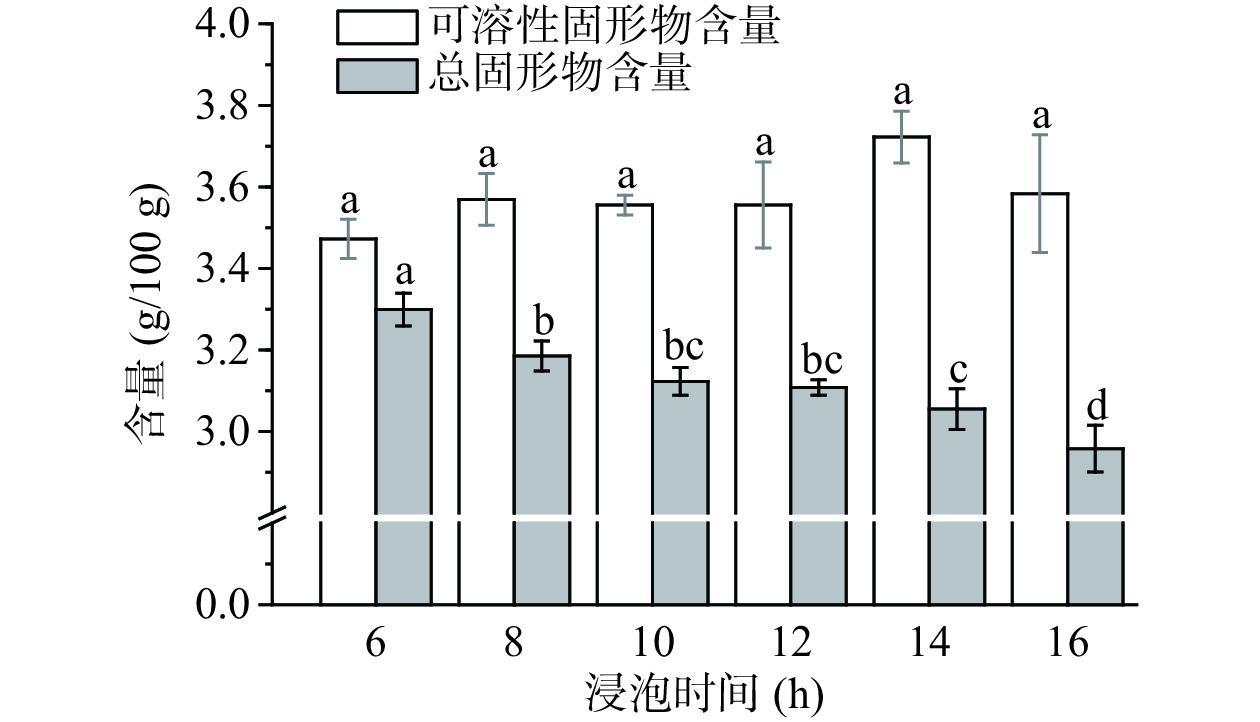
可溶性固形物含量表示还原糖的含量[27]。如图3所示,可溶性固形物含量随着浸泡时间的增加无显著性差异(P>0.05),陈修红等[28]也得到此结果。14 h的豆浆可溶性固形物含量最高,陈修红等[28]研究发现12 h时豆浆的可溶性固形物含量最高,结果不一致的原因可能是制作豆浆的工艺不同(本文使用生浆法,其使用熟浆法)。豆浆的总固形物含量随着浸泡时间的延长呈现下降趋势,大豆浸泡处理6 h的豆浆总固形物含量最高。这是由随着浸泡时间的延长,大豆吸水率增大[17],大豆的含水量变高,其干物质含量降低导致的。可溶性固形物多于总固形物的原因是测定总固形物含量的过程中,氨基酸、糖类、糖醇等豆浆溶液中的溶质在长时间的干燥过程中随水升华散失[29],因此总固形物含量的结果与实际值相比偏小。
2.4 大豆浸泡时间对豆浆粒径分布的影响
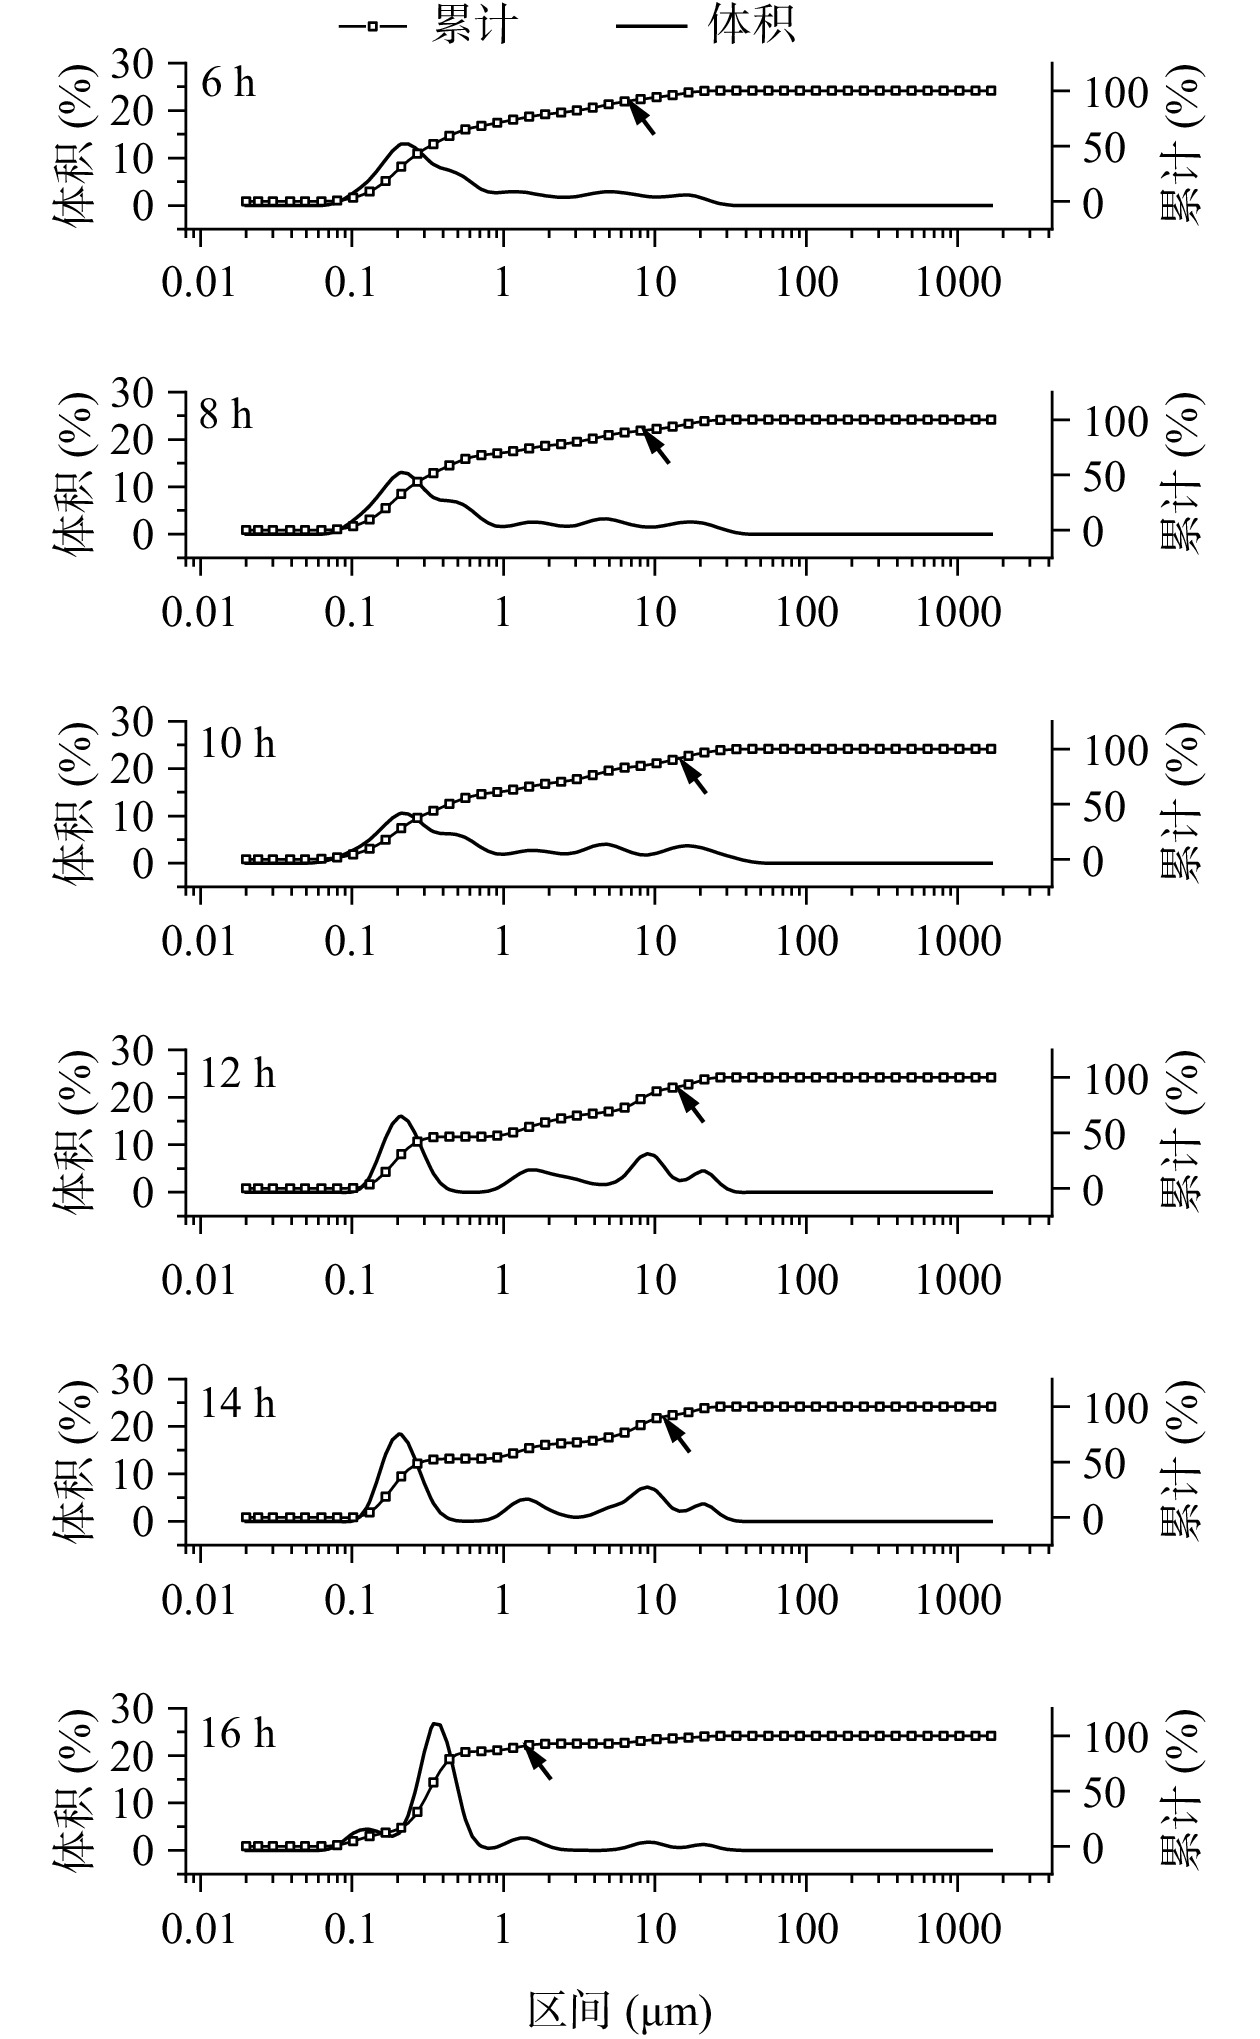
由图4可知,6个时间的豆浆粒径分布趋势大致相同,均分布在0.1~250 µm之间,豆浆粒径大都集中在0.1~1 µm范围处,且在0.01~1、1~10、10~100 µm出现峰值。随着浸泡时间的延长,豆浆粒径在0.01~1 µm区间内的体积分布逐渐增加,此区间内浸泡时间6 h的豆浆粒径体积累计量最小为53.46%,浸泡时间16 h的豆浆粒径体积累计量最大达到88.16%。
由表2可知,豆浆的粒径存在着较大差异,豆浆体积平均粒径[4,3]呈现先增大后减小的趋势,10 h的豆浆体积平均粒径[4,3]最大,12 h的豆浆次之,16 h的豆浆最小。原因是随着浸泡时间的延长大豆组织逐渐软化,提高了细胞在磨浆过程中的破碎程度,蛋白质、脂肪等物质的提取率增高,导致豆浆的体积平均粒径[4,3]增大;但是在12、14 h的豆浆中,由于1~10 µm的脂肪-蛋白复合体或者脂肪聚集体[11]增多,导致体积平均粒径[4,3]降低;16 h的豆浆主要由0.1~1 µm的颗粒组成(图4),其粒径体积累计量在1 µm附近已达到90%,且豆浆总固体物含量显著低于其他时间(P<0.05),因此其体积平均粒径[4,3]最低。而且可溶性蛋白质颗粒大小在0~40 nm,过长时间的浸泡导致浸泡液中可溶性蛋白质含量损失增加[3],不利于大豆在磨浆时蛋白质与脂肪的充分乳化,其含量的降低导致体积平均粒径[4,3]减小。8、10、12 h的豆浆体积平均粒径[4,3]显著高于14、16 h的豆浆(P<0.05)。说明8~12 h的浸泡时间利于磨浆时大豆中营养物质的溶出,豆浆粒径分布均匀。
表 2 大豆不同浸泡时间豆浆的粒径分析Table 2. Particle size analysis of soymilk with different soybean soaking time浸泡时间(h) 面积平均径[3,2](µm) 体积平均径[4,3](µm) 中位径(D50)(µm) 6 0.38±0.02bc 3.50±1.04ab 0.43±0.03b 8 0.39±0.02bc 4.34±1.60a 0.48±0.06b 10 0.41±0.01ab 5.17±0.87a 0.57±0.01b 12 0.49±0.07a 4.87±0.65a 1.13±0.37a 14 0.31±0.10c 1.69±2.44b 0.31±0.06b 16 0.33±0.03bc 0.98±0.46b 0.40±0.03b 2.5 大豆浸泡时间对豆浆黏度的影响
黏度的变化反映了蛋白质分子间作用力的变化,蛋白质属于豆浆溶液中的高分子,豆浆的黏度越高说明蛋白质分子吸引力越强,分子摩擦力越强[30−31]。如图5所示,随着浸泡时间的延长,豆浆黏度呈现先升高后降低的趋势,在大豆浸泡时间为10 h的豆浆黏度最高,黏度为3.42±0.04 cP。王君立等[21]研究表明蛋白质含量高且蛋白颗粒大的豆浆黏度高。10 h的可溶性蛋白质含量仅次于8 h豆浆,分布于蛋白质粒子表面的酸性多肽与7S的α、α'亚基增加,提高了蛋白质粒子的亲水性,这可能是豆浆黏度增高的一个重要原因[18]。而且浸泡时间为6、8、10 h时豆浆的粒径分布均匀,但是与6、8 h豆浆相比,其中10 h的体积平均径最大,在10 µm后其体积累计量达到90%(图4),说明豆浆中粒径大的颗粒占比高,所以转子转动时受到的阻力最大,导致10 h的豆浆黏度高。
2.6 大豆浸泡时间对豆浆稳定性的影响
Jin等 [1]、李笑梅等[6]、李若姝等[32]对豆浆品质提出要求:在满足蛋白质利用率高、风味浓厚、口感细腻的基础上,豆浆应具有一定稳定性。稳定性测定结果如图6所示,豆浆稳定性随着浸泡时间的延长呈现先降低后升高的趋势,在大豆浸泡时间为10 h的豆浆稳定性显著低于其他时间(P<0.05)。豆浆的稳定性与颗粒大小有关[33],豆浆的体积平均粒径随着浸泡时间的延长呈先增大后降低的趋势(表2),10 h的豆浆体积平均粒径最大,根据斯托克斯法则[18],在一定的黏度和密度下,粒子的直径越大,沉降速度也就越大,稳定性变小,所以10 h的豆浆稳定性最差。比较6、8和10 h的粒径分布发现大豆浸泡6和8 h得到的豆浆在10 µm前已达到90%的累计分布,且10 h的稳定性(0.88)显著低于6和8 h的稳定性(0.94)(P<0.05),因此从豆浆颗粒的粒径分布角度考虑,6和8 h的豆浆较好,粒径分布区间小,同时乳液体系稳定性好。
2.7 大豆浸泡时间对豆浆色差的影响
豆浆呈现的是有光泽的淡黄色或者乳白色,色差是评判豆浆品质的重要指标之一。如图7所示,大豆在6~16 h浸泡后的豆浆亮度值L分布范围在40.47~42.27,大豆浸泡时间6 h的豆浆L值最高,其次是10 h的豆浆。a值的分布范围−0.96~−0.76为负值,因此豆浆颜色呈偏微弱的绿色[22],随着浸泡时间的延长豆浆a值增加,说明浸泡使豆浆绿色程度减小,逐渐偏向暖色调红色。这是浸泡时间的增加,豆浆中提取的绿色色素浓度降低导致的[7]。b值的分布范围1.77~2.64为正,大豆浸泡时间8 h的豆浆b值最低,其次是12 h的豆浆。8 h的豆浆的黄色最浅,可接受度高,但是与6 h相比其亮度低,这可能是8 h的蛋白质含量和可溶性固形物含量高,豆浆加热过程中发生美拉德反应引起较明显的褐变导致的[30]。
根据以上结果可知,6 h豆浆的总固形物含量高,但其蛋白质转移率低,亮度值高但颜色偏黄;8 h豆浆的蛋白质含量最高,总固形物含量仅次于6 h的豆浆,颜色呈浅黄色,亮度却最低;10 h豆浆的体积平均粒径最大,黏度最高,但其稳定性差;超过10 h后豆浆的可溶性蛋白质含量、蛋白质转移率、总固形物含量、体积平均粒径均呈现降低趋势,且12、14、16 h的豆浆的黏度和稳定性均与8 h的豆浆并无显著差异(P>0.05)。可以判断出浸泡8 h制得的豆浆理化品质相对较好。
2.8 大豆浸泡时间对豆浆感官评价的影响
一般认为,如果评分小组成员对豆浆某一指标的评价结果差异不大,则该指标对区分豆浆质量的能力较弱,反之就偏强;因此可由变异系数计算豆浆的客观权重值,综合主观、客观得到的权重更加让人信服[22]。色泽、香气、润滑度、口感浓度、滋味的权重值由所有豆浆的感官评分来确定。由图8可知,在豆浆的五项感官指标中,色泽的主观权重值最高,客观权重值最低,分别为0.2219和0.1074;说明外观颜色对于豆浆的选择非常重要,同时也是小组成员对豆浆产品的颜色较为满意,造成了总体评分偏高;口感浓度在客观权重值中最高,在主观权重值中最低,分别为0.3039和0.1794。综合权重值由高到低依次为口感浓度、滋味、香气、润滑度、色泽,这与陈聪[22]得到的结果相似。
将指标正向化、无量纲化后,计算不同浸泡时间的豆浆质量优异情况如图9所示。随着大豆浸泡时间的延长豆浆的感官评分值降低,8和10 h的豆浆评分优于其他时间的豆浆,其中8 h的豆浆滋味、香气、色泽突出,10 h的豆浆润滑度和口感浓度突出。8 h豆浆的色泽得分最高,且色差b值最低(见图7),说明黄色越浅的豆浆更受到专家的喜欢。10 h的豆浆黏度高(见图5),豆浆易黏附在口腔壁上,停留时间长[12],口感醇厚,因此其口感浓度得分高。
采用线性综合法、几何综合法和混合综合法[22]对不同豆浆的感官评分计算结果见表3。由表3可知,8 h浸泡处理的豆浆评价值最高,其次是10 h浸泡处理的豆浆。大豆浸泡12 h后吸水达到平衡[17],但是随着浸泡时间的延长,感官评分值却降低,主要是滋味和口感浓度降低,这是因为14、16 h浸泡处理的豆浆总固形物含量显著低于其他样品(P<0.05)。根据感官评分结果,选择8 h浸泡大豆作为制作豆浆的最佳处理时间,与豆浆理化特性判断的结果一致。
表 3 大豆不同浸泡时间豆浆的综合评分值及排序Table 3. Comprehensive score and ranking of soymilk with different soybean soaking time浸泡时间
(h)线性
综合值排序 几何
综合值排序 综合
评分值最终排序 6 1.0171 3 1.0167 3 1.0169 3 8 1.0468 1 1.0464 1 1.0466 1 10 1.0385 2 1.0382 2 1.0384 2 12 1.0137 4 1.0133 4 1.0135 4 14 0.9604 5 0.9599 5 0.9602 5 16 0.9234 6 0.9220 6 0.9227 6 2.9 大豆水分组成与豆浆理化特性和感官评价之间的相关性分析
由图10可知,浸泡时间与大豆水分组成比例存在显著相关性:浸泡时间与大豆结合水占比、自由水占比达到显著负相关水平(r=−0.9638**、−0.8241*),与吸附水占比达到显著正相关水平(r=0.9391**)。浸泡时间与豆浆可溶性蛋白质达到显著相关水平(r=−0.9122*);与豆浆总固形物含量达到极显著相关水平(r=−0.9726**);与豆浆色差L、a分别呈显著相关−0.8238*、0.9385**,表明浸泡时间影响豆浆品质,研究浸泡时间对豆浆品质的影响具有意义。大豆水分组成比例与豆浆理化特性存在显著相关性:大豆结合水占比与可溶性蛋白质含量呈显著正相关(r=0.8634*),与总固形物含量呈极显著正相关(r=0.9334**);大豆吸附水占比与可溶性蛋白质含量呈显著负相关(r=−0.8758*),与总固形物含量呈显著负相关(r=−0.8799*),这是因为结合水与蛋白质、淀粉等大分子紧密结合;大豆吸附水以氢键方式与大分子结合,浸泡时间越长,吸附水占比增加,对蛋白质、多糖等大分子的束缚力增强而不易溶解在水中[34],因此导致可溶性蛋白质、总固形物含量降低。大豆自由水不受大豆组织细胞内大分子的吸附,能够自由移动[23],因此与可溶性蛋白质含量、总固形物含量相关性不显著(P>0.05)。
豆浆的总固形物含量与浸泡时间达到极显著负相关水平(r=−0.9726**),与色差L、a值呈显著相关,相关系数分别为0.8690*、−0.9272**;与感官评价中色泽评分值呈正相关但并不显著(r=0.7308),这说明缩短浸泡时间,有利于增加豆浆的总固形物提取率,提高豆浆亮度值,降低豆浆红蓝值,更容易让消费者接受[22]。豆浆的面积平均粒径、体积平均粒径、中位粒径均与浸泡时间呈负相关,但相关性均不显著,相关性分别为−0.3437、−0.6431、−0.0214,说明粒径的特征值并不能呈现整体的颗粒大小情况,需要结合粒径分布曲线判断豆浆的颗粒组成情况。豆浆感官评价的五项指标均与浸泡时间呈负相关,其中滋味评分值与浸泡时间呈显著负相关(r=−0.8860*),说明缩短浸泡时间有利于降低豆浆的涩味[35],提升豆浆的滋味。豆浆的稳定性与润滑度呈显著负相关(r=−0.8265*);与可溶性蛋白质含量、总固形物含量、粒径和黏度均呈负相关,未达到显著相关水平,说明豆浆的稳定性不能仅从豆浆组成和颗粒间的相互作用进行判断,李笑梅等[6]的研究也证明豆浆稳定性与其他品质指标的相关性不显著,不具有明显的规律。
3. 结论
通过对大豆水分组成、豆浆理化特性及感官品质的变化研究发现:随浸泡时间的延长,吸附水的占比增加,结合水占比降低,种子内水分自由度增加,流动性增强。缩短浸泡时间提升了豆浆的总固体提取率,改善了豆浆亮度和滋味,有利于提高豆浆的品质。浸泡处理8 h制得的豆浆综合品质最好:豆浆滋味、香气、色泽突出,感官评分值最高;可溶性蛋白质含量0.905 g/100 g,粒径分布均匀,乳液体系稳定性高于0.90;豆浆呈浅黄色,消费者接受度高,但是因具有较低的黏度而口感评分低于10 h豆浆。
大豆水分组成、豆浆理化特性及感官品质之间存在着复杂相关关系,其中结合水占比、可溶性蛋白质含量、总固形物含量、色差L值存在显著性正相关关系(P<0.05),感官评价、可溶性蛋白质含量、总固体物含量、豆浆体积平均粒径存在显著性正相关关系(P<0.05),浸泡后大豆的结合水占比越高,吸附水占比越低,豆浆营养物质提取率越高,豆浆的感官得分越高,综合品质好。
-
表 1 浸泡过程大豆各类水分组成的峰面积占比
Table 1 Proportion of peak area of various water components during soybean soaking
浸泡时间(h) M21(%) M22(%) M23(%) 6 12.00±0.55a 81.78±0.93c 6.22±0.59ab 8 10.88±1.46ab 82.52±1.47bc 6.60±0.47a 10 10.53±1.17bc 84.11±1.65b 5.33±0.83bc 12 9.54±1.28bcd 86.05±1.20a 4.41±1.31c 14 9.02±0.59cd 86.34±0.45a 4.64±0.84c 16 9.08±0.45d 86.09±0.83a 4.83±0.46c 注:表中同一列不同小写字母表示具有显著性差异(P<0.05),表2同。 表 2 大豆不同浸泡时间豆浆的粒径分析
Table 2 Particle size analysis of soymilk with different soybean soaking time
浸泡时间(h) 面积平均径[3,2](µm) 体积平均径[4,3](µm) 中位径(D50)(µm) 6 0.38±0.02bc 3.50±1.04ab 0.43±0.03b 8 0.39±0.02bc 4.34±1.60a 0.48±0.06b 10 0.41±0.01ab 5.17±0.87a 0.57±0.01b 12 0.49±0.07a 4.87±0.65a 1.13±0.37a 14 0.31±0.10c 1.69±2.44b 0.31±0.06b 16 0.33±0.03bc 0.98±0.46b 0.40±0.03b 表 3 大豆不同浸泡时间豆浆的综合评分值及排序
Table 3 Comprehensive score and ranking of soymilk with different soybean soaking time
浸泡时间
(h)线性
综合值排序 几何
综合值排序 综合
评分值最终排序 6 1.0171 3 1.0167 3 1.0169 3 8 1.0468 1 1.0464 1 1.0466 1 10 1.0385 2 1.0382 2 1.0384 2 12 1.0137 4 1.0133 4 1.0135 4 14 0.9604 5 0.9599 5 0.9602 5 16 0.9234 6 0.9220 6 0.9227 6 -
[1] JIN X, CHEN C, GUO S, et al. Analysis on physicochemical and sensory qualities of soymilk prepared by various cultivars:Application of fuzzy logic technique[J]. Journal of Food Science,2020,85(6):1635−1641. doi: 10.1111/1750-3841.15147
[2] KAHARSO V C, MUHOZA B, KONG X, et al. Quality improvement of soymilk as influenced by anaerobic grinding method and calcium addition[J]. Food Bioscience,2021,42:101210. doi: 10.1016/j.fbio.2021.101210
[3] LI X, LIU X, HUA Y, et al. Effects of water absorption of soybean seed on the quality of soymilk and the release of flavor compounds[J]. Royal Society of Chemistry,2019,9(6):2906−2918.
[4] 郭晓菲, 郭琪琪, 林晓姿, 等. 脱皮大豆等温吸水模型与复水磨浆工艺参数优化[J]. 食品工业科技,2020,41(13):207−211, 226. [GUO Xiaofei, GUO Qiqi, LIN Xiaozi, et al. Isothermal water absorption model of peeled soybean and optimization of process parameters of rehydration[J]. Science and Technology of Food Industry,2020,41(13):207−211, 226.] GUO Xiaofei, GUO Qiqi, LIN Xiaozi, et al. Isothermal water absorption model of peeled soybean and optimization of process parameters of rehydration[J]. Science and Technology of Food Industry, 2020, 41(13): 207−211, 226.
[5] 董巧. 家用豆浆机制浆工艺优化及豆浆营养和感官品质评价体系的建立[D]. 扬州:扬州大学, 2016. [DONG Qiao. Optimization of household soy milk machine pulp process and establishment of soy milk nutrition and sensory quality evaluation system[D]. Yangzhou:Yangzhou University, 2016.] DONG Qiao. Optimization of household soy milk machine pulp process and establishment of soy milk nutrition and sensory quality evaluation system[D]. Yangzhou: Yangzhou University, 2016.
[6] 李笑梅, 邢竺静, 赵廉诚, 等. 基于主成分与聚类分析法的制备豆浆用大豆的品质指标综合评价[J]. 食品科学,2020,41(15):64−71. [LI Xiaomei, XING Zhujing, ZHAO Liancheng, et al. Comprehensive evaluation of soybean milk dedicated soybean quality based on principal component and cluster analysis[J]. Food Science,2020,41(15):64−71.] doi: 10.7506/spkx1002-6630-20190809-105 LI Xiaomei, XING Zhujing, ZHAO Liancheng, et al. Comprehensive evaluation of soybean milk dedicated soybean quality based on principal component and cluster analysis[J]. Food Science, 2020, 41(15): 64−71. doi: 10.7506/spkx1002-6630-20190809-105
[7] XU L, CHEN L, SUN W. Effects of soaking and tempering temperature on microstructure and mechanical properties of 65Si2MnWE spring steel[J]. Vacuum,2018,154:322−332. doi: 10.1016/j.vacuum.2018.05.029
[8] 石彦国, 李刚, 胡春林, 等. 大豆浸泡过程质构变化及其对豆腐质量的影响[J]. 食品科学,2006,27(12):167−169. [SHI Yanguo, LI Gang, HU Chunlin, et al. Effect of soaking time on the quality of tofu[J]. Food Science,2006,27(12):167−169.] doi: 10.3321/j.issn:1002-6630.2006.12.033 SHI Yanguo, LI Gang, HU Chunlin, et al. Effect of soaking time on the quality of tofu[J]. Food Science, 2006, 27(12): 167−169. doi: 10.3321/j.issn:1002-6630.2006.12.033
[9] BABALOLA F, FAJOYE O. Temperature and time model for optimum nutritional contents in soymilk processing[J]. European Journal of Biology and Biotechnology,2021,2:45−50. doi: 10.24018/ejbio.2021.2.2.163
[10] 崔亚丽, 李莹莹, 栾广忠, 等. 豆浆粒径与豆浆品质的关系研究[J]. 大豆科学,2012,31(1):103−107. [CUI Yali, LI Yingying, LUAN Guangzhong, et al. Relationship between particle size and quality of soymilk[J]. Soybean Science,2012,31(1):103−107.] doi: 10.3969/j.issn.1000-9841.2012.01.023 CUI Yali, LI Yingying, LUAN Guangzhong, et al. Relationship between particle size and quality of soymilk[J]. Soybean Science, 2012, 31(1): 103−107. doi: 10.3969/j.issn.1000-9841.2012.01.023
[11] 陈军, 方锐琳, 梁亚桢, 等. 全豆豆浆的高压射流磨制备工艺及贮藏稳定性研究[J]. 食品工业科技,2021,42(19):173−181. [CHEN Jun, FANG Ruilin, LIANG Yazhen, et al. Study on preparation and storage stability of whole soybean milk by high-pressure microfluidizer[J]. Science and Technology of Food Industry,2021,42(19):173−181.] CHEN Jun, FANG Ruilin, LIANG Yazhen, et al. Study on preparation and storage stability of whole soybean milk by high-pressure microfluidizer[J]. Science and Technology of Food Industry, 2021, 42(19): 173−181.
[12] 吕玉翠. 豆浆和大豆浓缩蛋白乳的热处理对其品质的影响[D]. 无锡:江南大学, 2013. [LÜ Yucui. Effect of thermal processes on the quality of soymilk and soy protein concentrate milk[D]. Wuxi:Jiangnan University, 2013.] LÜ Yucui. Effect of thermal processes on the quality of soymilk and soy protein concentrate milk[D]. Wuxi: Jiangnan University, 2013.
[13] 李惠纳. 种子内源性蛋白酶在大豆加工中的运用研究[D]. 无锡:江南大学, 2021. [LI Huina. Study on the applications of seed endogenous proteases in soybean processing[D]. Wuxi:Jiangnan University, 2021.] LI Huina. Study on the applications of seed endogenous proteases in soybean processing[D]. Wuxi: Jiangnan University, 2021.
[14] 姜雷. 多重预处理工艺对豆浆抗营养因子与品质影响研究[D]. 长春:吉林农业大学, 2019. [JIANG Lei. Effect of multiple pretreatment processes on anti-nutritional factors and quality of soymilk[D]. Changchun:Jilin Agricultural University, 2019.] JIANG Lei. Effect of multiple pretreatment processes on anti-nutritional factors and quality of soymilk[D]. Changchun: Jilin Agricultural University, 2019.
[15] 杨蕊莲. 豆浆工艺优化及预处理对其品质影响研究[D]. 重庆:西南大学, 2016. [YANG Ruilian. Study on optimization of soymilk processing and effect of different pretreatment on the quality of soymilk[D]. Chongqin:Southwest University, 2016.] YANG Ruilian. Study on optimization of soymilk processing and effect of different pretreatment on the quality of soymilk[D]. Chongqin: Southwest University, 2016.
[16] 李鹏. 黑豆吸水模型及预熟化过程结构变化的研究[D]. 无锡:江南大学, 2020. [LI Peng. Study on water absorption model and structural changes during precooking of black beans[D]. Wuxi:Jiangnan University, 2020.] LI Peng. Study on water absorption model and structural changes during precooking of black beans[D]. Wuxi: Jiangnan University, 2020.
[17] LIMA F S D, KUROZAWA L E, IDA E I. The effects of soybean soaking on grain properties and isoflavones loss[J]. LWT-Food Science and Technology,2014,59:1274−1282. doi: 10.1016/j.lwt.2014.04.032
[18] 范柳, 刘海宇, 赵良忠, 等. 不同制浆工艺对豆浆品质的影响[J]. 食品与发酵工业,2020,46(7):148−154. [FAN Liu, LIU Haiyu, ZHAO Liangzhong, et al. Study on the influence of different pulping processes on the quality of soymilk[J]. Food and Fermentation Industries,2020,46(7):148−154.] FAN Liu, LIU Haiyu, ZHAO Liangzhong, et al. Study on the influence of different pulping processes on the quality of soymilk[J]. Food and Fermentation Industries, 2020, 46(7): 148−154.
[19] KAMIZAKE N K K, SILVA L C P, PRUDENCIO S H. Effect of soybean aging on the quality of soymilk, firmness of tofu and optimum coagulant concentration[J]. Food Chemistry,2016,190:90−96. doi: 10.1016/j.foodchem.2015.05.041
[20] 李琪, 李云龙, 李红梅, 等. 苦荞浓浆饮料稳定性技术研究[J]. 粮食与油脂,2023,36(3):114−118. [LI Qi, LI Yunlong, LI Hongmei, et al. Study on the stability technology of tartary buckwheat thick beverage[J]. Cereals and Oils,2023,36(3):114−118.] doi: 10.3969/j.issn.1008-9578.2023.03.026 LI Qi, LI Yunlong, LI Hongmei, et al. Study on the stability technology of tartary buckwheat thick beverage[J]. Cereals and Oils, 2023, 36(3): 114−118. doi: 10.3969/j.issn.1008-9578.2023.03.026
[21] 王君立, 唐传核, 周志红, 等. 微生物转谷氨酰胺酶促豆腐质构性质研究[J]. 粮食加工,2006(3):77−80. [WANG Junli, TANG Chuanhe, ZHOU Zhihong, et al. The study on the texture of microbial transglutaminase tofu[J]. Grain Processing,2006(3):77−80.] doi: 10.3969/j.issn.1007-6395.2006.03.026 WANG Junli, TANG Chuanhe, ZHOU Zhihong, et al. The study on the texture of microbial transglutaminase tofu[J]. Grain Processing, 2006(3): 77−80. doi: 10.3969/j.issn.1007-6395.2006.03.026
[22] 陈聪. 豆浆熟浆关键工艺及熟制过程美拉德反应的研究[D]. 无锡:江南大学, 2013. [CHEN Cong. Study on the key technology of cooked- slurry soymilk and Maillard reaction during heating treatment[D]. Wuxi:Jiangnan University, 2013.] CHEN Cong. Study on the key technology of cooked- slurry soymilk and Maillard reaction during heating treatment[D]. Wuxi: Jiangnan University, 2013.
[23] 滕文静. 大豆萌发对其营养成分及豆腐制品品质的影响研究[D]. 杭州:浙江工商大学, 2019. [TENG Wenjing. Effects of soybean germination on nutritional components and quality of tofu products[D]. Hangzhou:Zhejiang Gongshang University, 2019.] TENG Wenjing. Effects of soybean germination on nutritional components and quality of tofu products[D]. Hangzhou: Zhejiang Gongshang University, 2019.
[24] 张瑞迪. 大豆储藏期间结露发生发展规律及对品质的影响[D]. 郑州:河南工业大学, 2021. [ZHANG Ruidi. Law of occurrence and development of dew condensation during storage of soybean and its influence on quality[D]. Zhengzhou:Henan University of Technology, 2021.] ZHANG Ruidi. Law of occurrence and development of dew condensation during storage of soybean and its influence on quality[D]. Zhengzhou: Henan University of Technology, 2021.
[25] PENG X, REN C, GUO S. Particle formation and gelation of soymilk:Effect of heat[J]. Trends in Food Science and Technology,2016,54:138−147. doi: 10.1016/j.jpgs.2016.06.005
[26] JOMDUANG S, BUNTHAWONG O. Optimal pre-treatment processes for microwavable puffed job’s tears grains[J]. Chiang Mai University Journal of Natural Sciences,2019,18(1):107−121.
[27] 李明, 赵良忠, 李新社, 等. 响应面法优化葛根酸豆奶配方[J]. 食品工业科技,2017,38(23):151−158. [LI Ming, ZHAO Liangzhong, LI Xinshe, et al. Optimizing the formula for Puerarin radix fermented soymilk by response surface methodology[J]. Science and Technology of Food Industry,2017,38(23):151−158.] LI Ming, ZHAO Liangzhong, LI Xinshe, et al. Optimizing the formula for Puerarin radix fermented soymilk by response surface methodology[J]. Science and Technology of Food Industry, 2017, 38(23): 151−158.
[28] 陈修红, 赵镭, 董巧, 等. 响应面法优化家用豆浆机湿豆制浆工艺[J]. 食品工业科技,2018,39(1):197−201. [CHEN Xiuhong, ZHAO Lei, DONG Qiao, et al. Pulping process optimization of domestic soybean milk machine by response surface methodology[J]. Science and Technology of Food Industry,2018,39(1):197−201.] CHEN Xiuhong, ZHAO Lei, DONG Qiao, et al. Pulping process optimization of domestic soybean milk machine by response surface methodology[J]. Science and Technology of Food Industry, 2018, 39(1): 197−201.
[29] 秦贯丰, 丁中祥, 原姣姣, 等. 苹果汁冷冻浓缩与真空蒸发浓缩效果的对比[J]. 食品科学,2020,41(7):102−109. [QIN Guanfeng, DING Zhongxiang, YUAN Jiaojiao, et al. Comparative experimental study on freeze concentration and vacuum evaporation concentration of apple juice[J]. Food Science,2020,41(7):102−109.] doi: 10.7506/spkx1002-6630-20190129-376 QIN Guanfeng, DING Zhongxiang, YUAN Jiaojiao, et al. Comparative experimental study on freeze concentration and vacuum evaporation concentration of apple juice[J]. Food Science, 2020, 41(7): 102−109. doi: 10.7506/spkx1002-6630-20190129-376
[30] WANG X B, CHI Y. Microwave-assisted phosphorylation of soybean protein isolates and their physicochemical properties[J]. Czech Journal of Food Sciences,2018,30:99−107.
[31] 李良, 田甜, 王冬梅, 等. 超声处理对豆浆流变学特性和微观结构的影响研究[J]. 食品科技,2019,44(2):110−115. [LI Liang, TIAN Tian, WANG Dongmei, et al. Effect of ultrasonic treatment on the rheological properties and microstructure of soybean milk[J]. Food Science and Technology,2019,44(2):110−115.] LI Liang, TIAN Tian, WANG Dongmei, et al. Effect of ultrasonic treatment on the rheological properties and microstructure of soybean milk[J]. Food Science and Technology, 2019, 44(2): 110−115.
[32] 李若姝, 刘香英, 田志刚, 等. 大豆品种籽粒品质对豆浆加工特性的影响[J]. 东北农业科学,2017,42(1):50−55. [LI Ruoshu, LIU Xiangying, TIAN Zhigang, et al. Effect of soybean varieties quality characteristics on soymilk processing quality[J]. Journal of Northeast Agricultural Sciences,2017,42(1):50−55.] LI Ruoshu, LIU Xiangying, TIAN Zhigang, et al. Effect of soybean varieties quality characteristics on soymilk processing quality[J]. Journal of Northeast Agricultural Sciences, 2017, 42(1): 50−55.
[33] 梁亚桢. 全豆豆浆及速溶全豆粉产品研发[D]. 南昌:南昌大学, 2020. [LIANG Yazheng. Rearch and development of whole soybean milk and instant thole soymilk powder[D]. Nanchang:Nanchang University, 2020.] LIANG Yazheng. Rearch and development of whole soybean milk and instant thole soymilk powder[D]. Nanchang: Nanchang University, 2020.
[34] 代伟长, 胡耀辉, 于寒松, 等. 基于低场核磁技术研究不同方法处理豆渣的水分分布[J]. 中国食品学报,2018,18(8):260−266. [DAI Weichang, HU Yaohui, YU Hansong, et al. The water distribution in the bean dregs by different processing treatments based on low-field nuclear magnetic resonance[J]. Journal of Chinese Institue of Food Science and Technology,2018,18(8):260−266.] DAI Weichang, HU Yaohui, YU Hansong, et al. The water distribution in the bean dregs by different processing treatments based on low-field nuclear magnetic resonance[J]. Journal of Chinese Institue of Food Science and Technology, 2018, 18(8): 260−266.
[35] 唐文义. 大豆品种及处理措施与豆浆品质关系研究[D]. 哈尔滨:东北农业大学, 2014. [TANG Wenyi. Research on the relationship of soybean cultivars treatment and soybean milk quality[D]. Harbin:Northeast Agricultural University, 2014.] TANG Wenyi. Research on the relationship of soybean cultivars treatment and soybean milk quality[D]. Harbin: Northeast Agricultural University, 2014.
-
期刊类型引用(15)
1. 刘荣倩,杨申明,李新会,王振吉,彭润,解健翠. 百香果壳总三萜提取工艺优化及抗氧化性能评价. 饲料工业. 2025(01): 118-126 .  百度学术
百度学术
2. 景炳年,李宁洁,魏磊,谢晓阳,刘雨晴,王学方,王韬,王伟. 连翘三萜酸提取工艺优化及抗氧化活性研究. 中国食品添加剂. 2025(03): 64-74 .  百度学术
百度学术
3. 黄瑜,张锡宇,赵海桃,石统帅,邱隽蒙,符群. 沙棘叶提取物的体外抗氧化及乙酰胆碱酯酶抑制能力. 精细化工. 2024(02): 391-400 .  百度学术
百度学术
4. 温舒然,马占山,詹冬玲. 灵芝三萜提取工艺的优化. 吉林大学学报(理学版). 2024(02): 452-463 .  百度学术
百度学术
5. 岳洪霞,胡娜,隆海燕,王洪伦,栾广祥. 响应面法优化超声辅助提取蕨麻总三萜工艺研究. 中国野生植物资源. 2024(03): 28-33+66 .  百度学术
百度学术
6. 杨洪飞,卢雨菲,葛婷婷,王洁琼,陈祺,孟丽媛,要辉,闵清. 星点设计-效应面法优化超声提取桂籽中三萜化合物的工艺研究. 湖北科技学院学报(医学版). 2024(03): 214-220 .  百度学术
百度学术
7. 曹柏营,杨海蛟,侯宇,王家利,乔新宇,陈英伟,刘馨阳. 蓝靛果花青素抗氧化作用及机制. 食品研究与开发. 2024(19): 53-59 .  百度学术
百度学术
8. 张剑林,张亮亮,姜露熙,裴龙英,王寒博,孙博,梁睿武,房丹丹. 基于人工神经网络优化黑木耳红枣发酵乳及其抗氧化分析. 食品研究与开发. 2023(05): 141-147 .  百度学术
百度学术
9. 沈柯辰,宋亚茹,高琳,张仁堂. 红枣固态发酵黑化前后苯甲酸及农药残留含量比较分析. 食品研究与开发. 2023(05): 177-183 .  百度学术
百度学术
10. 刘树萍,陆家慧,张佳美,彭秀文,苏晓文,石长波. 奇亚籽胶提取工艺优化及其理化性质. 食品研究与开发. 2023(22): 53-60 .  百度学术
百度学术
11. 林瑞,杜秋旻,李永春,闫美霖,何家丽,苗晶囡,徐丹,邱军强. 黄药子中黄独乙素提取工艺研究. 吉林医药学院学报. 2022(02): 91-94 .  百度学术
百度学术
12. 李金金,孟琦,崔馨燕,石汝杰,吴应梅,杨玲,周浓. 响应面法优化地参三萜酸提取工艺及抗氧化活性分析. 南方农业学报. 2022(08): 2261-2271 .  百度学术
百度学术
13. 刘嘉鑫,陈小梅,曾慧,王淑美,向丽敏. 响应面法优化蒲桃籽中三萜类化合物的提取工艺及其抗氧化活性分析. 食品工业科技. 2022(23): 192-199 .  本站查看
本站查看
14. 周海旭,苏同超,李姝,冉军舰,李波,高晗,余梦薇,薛静丽,李婧瑜,李晓晴,李忠海. 樟叶木脂素的提取纯化及其抗氧化性、抗癌活性. 食品工业科技. 2021(13): 170-178 .  本站查看
本站查看
15. 王吉宇,李成文,徐彦靖,于青,刘楠,刘东春. 响应面法优化藏红花素碱水解制备反式藏红花酸工艺. 食品工业科技. 2021(23): 176-183 .  本站查看
本站查看
其他类型引用(9)



 下载:
下载:





 下载:
下载:


