Evaluation of White Tea Grades Based on Near Infrared Spectroscopy and Gas Chromatography-Ion Mobility Spectroscopy
-
摘要: 茶叶等级评价是一项复杂的主观性系统工作,从其相关品质数据中提取等级信息,进而建立茶叶等级快速识别方法,这对指导茶叶生产具有重要意义。为建立快速评价白茶等级的判别模型,本研究搜集了200份不同等级的白牡丹白茶,采集其近红外光谱和气相离子迁移谱的原始数据,经过主成分分析或线性判别分析进行数据降维,结合7种分类器算法开展白茶等级评价。结果表明,线性判别分析适合近红外光谱和气相离子迁移谱的原始数据降维;原始数据使用线性判别分析降维后,基于近红外光谱建立的自适应增强(adaptive boosting,Adaboost)、K近邻(k-nearest neighbor,KNN)、多层感知机(multilayer perceptron,MLP)、随机森林(random forest,RF)、随机梯度下降(stochastic gradient descent,SGD)和支持向量机(support vector machines, SVM)模型的正判率均>94%,模型评价指标AUC≥0.95;基于气相离子迁移谱筛选的图谱数据建立的MLP、SGD和SVM模型的判别率为91%~93%,AUC值为0.94~0.96;基于气相离子迁移谱的标记物质数据构建的Adaboost、决策树(decision tree,DT)、KNN、MLP、SGD和SVM模型正判率均为100%,AUC为1.0,RF的正判率为96%、AUC值为0.98。综上,以近红外光谱和挥发性化合物特征数据作为白茶等级评价的重要参数,分别建成了6个和10个等级判别模型,可准确判定白茶等级,分类器算法适用于这2种类型数据建模。Abstract: Tea grade evaluation is a systematic work with complex and subjective. Grade information from its relevant quality data extracted enables to establish rapid identification method, later of which has guiding meaning to tea production. To establish a rapid identification method of white tea grades, 200 white tea (Bai Mudan) samples with 4 grades were selected as the research objects in this paper, near infrared spectroscopy and gas chromatography-ion mobility spectrometry were used to collect original data. The data dimensions were reduced by principal component analysis or linear discriminant analysis, combed with 7 data mining classifier algorithms to rapidly evaluate the grades of white tea. Results showed that linear discriminant analysis was suitable for dimensionality reduction of the original data from near infrared spectra and gas chromatography-ion mobility spectrometry. After dimensionality reduction of the original data using linear discriminant analysis, classification algorithm including adaptive boosting (Adaboost), k-nearest neighbor (KNN) and multi-layer perceptron (MLP), and random forests (RF), stochastic gradient descent (SGD) and support vector machines (SVM) were used for establishment of white tea grade discriminant models based on near infrared spectroscopy, the correct rate of these models were greater than 94%, and the AUC of the model evaluation index was≥0.95. The discriminant rates of MLP, SGD and SVM models based on gas chromatography-ion mobility spectrometry filtered spectrum data were 91%~93% and the AUC value were 0.94~0.96. The positive judgment rate of models from Adaboost, decision tree (DT), KNN, MLP, SGD and SVM models based on gas chromatography-ion mobility spectrometry labeled substance data was 100%, and the AUC was 1.0, while the model evaluation index of RF model were 96% and 0.98, respectively. With near infrared spectrum and volatile compound characteristic data as important parameters for white tea grade evaluation, 6 and 10 kinds of grade discrimination models were built, which could accurately determine the grade of white tea, and the classifier algorithm was suitable for the modeling of these two types of data.
-
白茶属微发酵茶,可分为白毫银针、白牡丹、贡眉和寿眉四类。近年来,白毫银针、白牡丹类高端白茶迎来消费热潮,贡眉、寿眉散茶等中低端产品的消费占比不断减小[1−2]。白茶的四个品类按照新梢嫩度区分,不同等级同品类产品间外形差异小,导致同级不同质、同级不同价等市场乱象频现[3]。因此,科学评价白茶等级对规范市场秩序、稳定和提高产品质量具有重要作用。
常规茶叶等级评价主要通过感官审评与内质分析。感官审评通常对干茶、叶底、茶汤的香气、滋味、色泽等因子进行综合评价、定级。内质分析通过使用感官智能分析系统(如电子舌[4−6]、电子鼻[7−8])、光谱技术(近红外光谱(near-infrared spectroscopy,NIR)[9−10]、高光谱[11]、紫外可见分光光度法[12])、色谱技术(气相色谱[13]、液相色谱[14−15])、计算机视觉技术(荧光探针[16]、图像[17])等,结合化学计量学方法,提取茶叶的等级特征并建立等级评价模型。感官智能分析系统属快速检测技术,灵敏性强、成本高,尚未实现产业化应用;光谱、色谱等分析技术,操作复杂、成本高;计算机视觉技术适合色泽和外观差异较大的样本,不适合白茶等级辨别。NIR技术具有高效、无损、低成本的优势,通过建立光谱数据与已知样品属性值的关联模型,可实现对未知样品属性值的快速预测,在绿茶[18−19]、红茶[20]、白茶[21]的等级评价已有诸多报道。与NIR技术相似,气相离子迁移谱(gas chromatography-ion mobility sepctrometry,GC-IMS)是一种高效、高分离、高灵敏度的挥发性物质检测技术,适合食品质量的快速鉴定[22]。目前,该技术已应用于绿茶风味[23−24]与等级[25]、黄茶加工香气品质监测[26]、白茶年份与产地鉴别[27−28]等。NIR和GC-IMS技术可采集大量样品特征信息,前人一般利用主成分分析(principal component analysis,PCA)结合偏最小二乘法(partial least square,PLS)等经典算法建立基于特征信息的分类模型,进行未知样品的属性值预测。上述算法建立的模型一般缺乏深度算法学习,且模型的预测能力和鲁棒性对数据预处理方法、波长选择、样本背景等因素依赖性强。因此,本文选用自适应增强(adaptive boosting,Adaboost)、决策树(decision tree,DT)、K近邻(k-nearest neighbor,KNN)、多层感知机(multilayer perceptron,MLP)、随机森林(random forest,RF)、随机梯度下降(stochastic gradient descent,SGD)、支持向量机(support vector machines, SVM)合计7种有监督学习的数据挖掘分类算法,基于不同等级白牡丹白茶的NIR和GC-IMS数据进行深度算法学习,开展白茶等级评价与分类模型研究,探索茶叶等级智能评判的可行性,并为其提供理论依据。
1. 材料与方法
1.1 材料与仪器
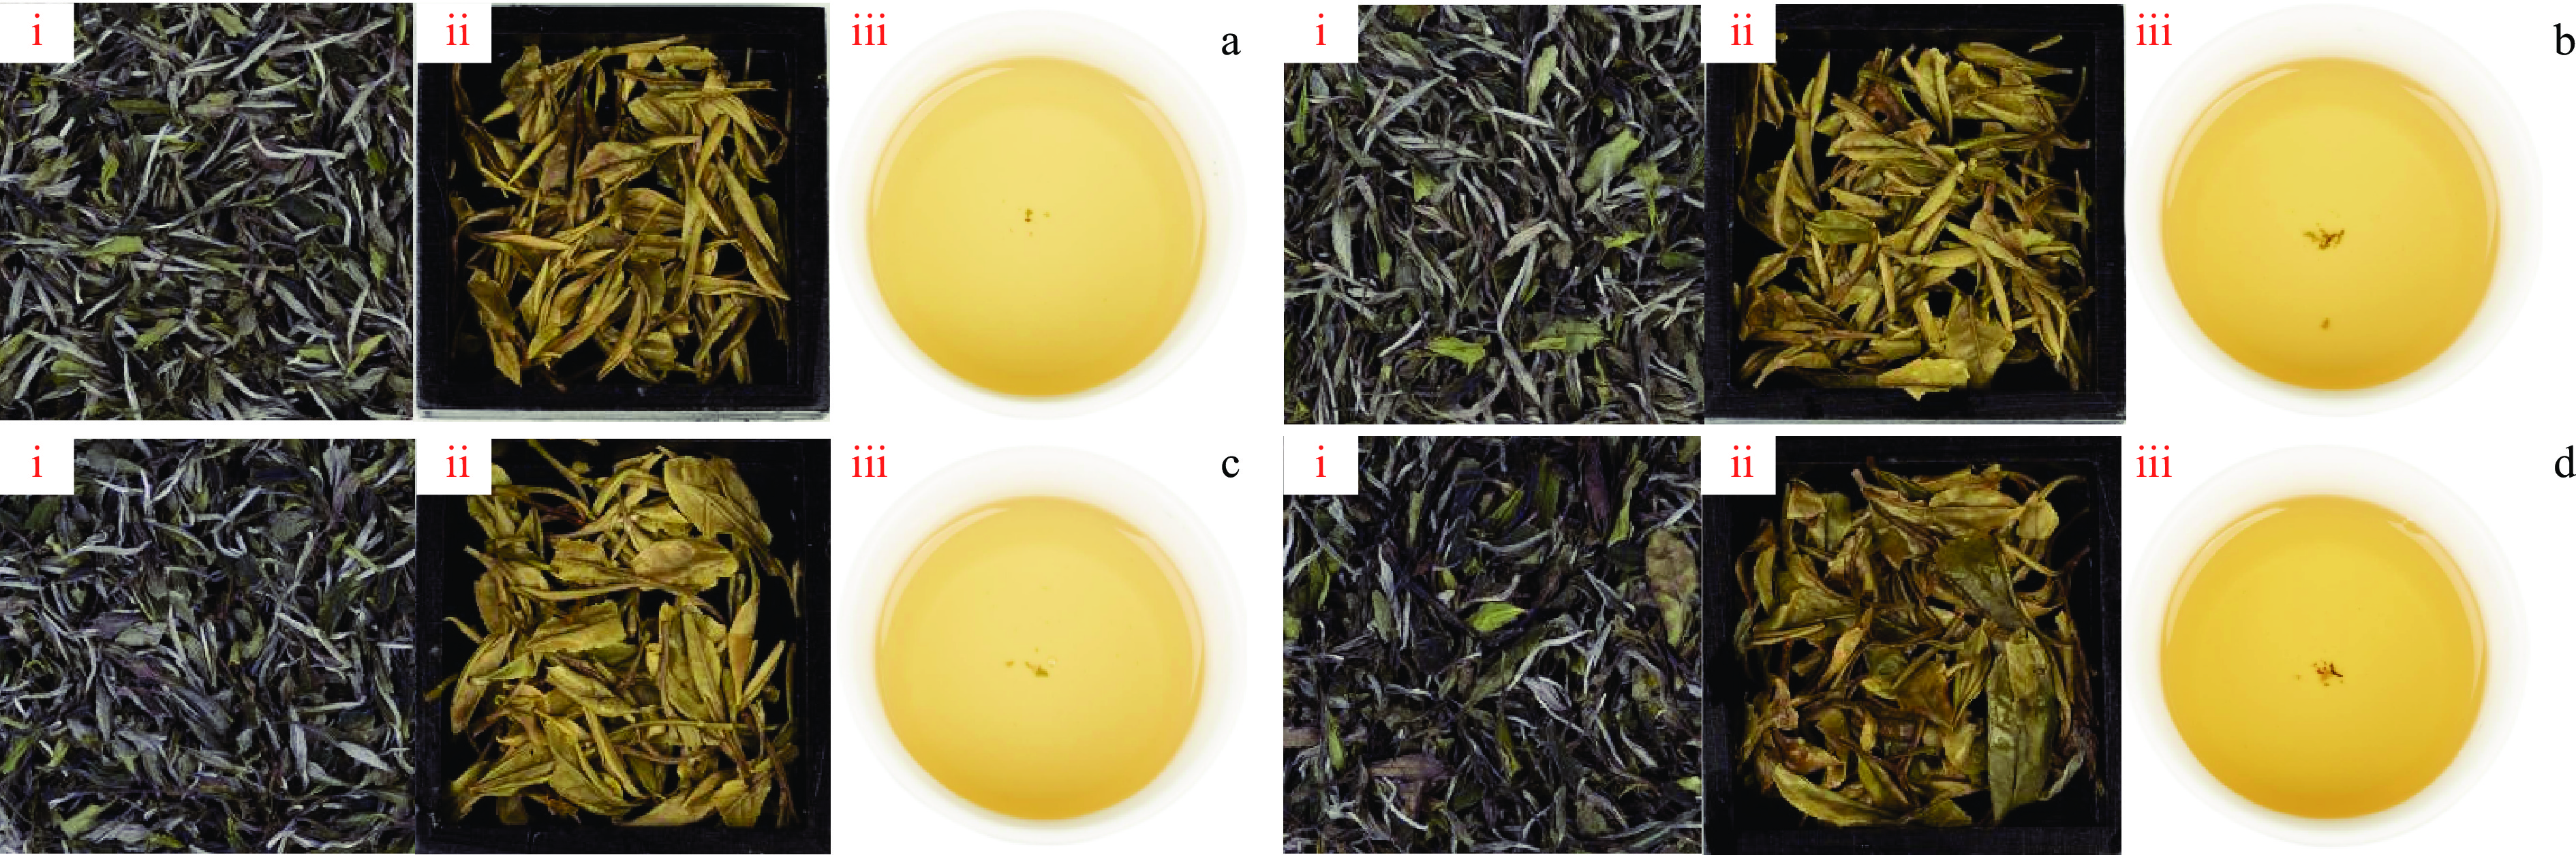
白牡丹茶样 由福建品品香茶业有限公司提供,品种为福鼎大毫茶,采制于2019年春季。依据国家标准GB/T 22291-2017《白茶》中白牡丹特级、一级、二级、三级的感官品质要求与GB/T 23776-2018《茶叶感官审评方法》,评价样品外形、香气、滋味和叶底,最终将200份茶样分为4个等级,每个等级各50份。如图1所示,不同等级间白牡丹样品的外形差异小,难以直观辨别。随后,使用高速粉碎机将茶样研磨成粉,过80目筛,置于4 ℃冰箱备用。用于后续NIR的光谱数据采集和GC-IMS的香气成分检测。
![]() 图 1 四个等级白牡丹(白茶)的干茶、叶底和茶汤注:a为特级白牡丹,b为一级白牡丹,c为二级白牡丹,d为三级白牡丹;i为干茶,ii为叶底,iii为茶汤。Figure 1. Dry leaves, infused leaves and the brewing of Bai Mudan white tea from four grades
图 1 四个等级白牡丹(白茶)的干茶、叶底和茶汤注:a为特级白牡丹,b为一级白牡丹,c为二级白牡丹,d为三级白牡丹;i为干茶,ii为叶底,iii为茶汤。Figure 1. Dry leaves, infused leaves and the brewing of Bai Mudan white tea from four gradesANTARIS Ⅱ FT-NIR型Analyzer傅立叶变换近红外光谱仪 美国Thermo Fisher Scientific公司;FlavourSpec®风味分析仪 德国G.A.S.公司;DFY-300高速粉碎机 上海鼎广机械设备有限公司;BSA124S电子天平 德国Sartorius公司;CFJ-Ⅱ茶叶筛分机 杭州大吉光电仪器有限公司。
1.2 实验方法
1.2.1 NIR光谱采集
NIR光谱采集方法参考沈诗钰等[28]的方法,采集温度为25 ℃,湿度<70%;采集时准确称取10.0±0.5 g茶粉平铺于样品旋转杯中,选择积分球采样模式。波数范围为4000~10000 cm−1,扫描次数64,分辨率8.0 cm−1。为确保近红外光谱检测数据的可靠性,样品采集前重新扫描1次背景,扣除空气背景光谱以降低环境因素对光谱数据的影响,每个样品重复采集其原始光谱3次,取其平均光谱作为最终量测光谱数据。
1.2.2 GC-IMS谱图采集
准确称取0.2000±0.0005 g茶粉于20 mL磁盖顶空瓶中,以80 ℃、500 r/min振动孵化15 min后进样,进样体积为200 µL。仪器检测条件参考罗玉琴等[29]的方法,初始漂移气体流速EPC1为150 mL/min,载气流速EPC2为2 mL/min,运行10 min后EPC1维持150 mL/min,EPC2流量爬升至10 mL/min,运行至30 min 时EPC1为150 mL/min,EPC2为130 mL/min,在30 min 20 s时结束运行程序,每个样品检测2次。
1.3 数据处理
应用TQ Analyst 8.0分析软件获取NIR谱图的原始数据;应用LAV 2.1.1软件采集和处理GC-IMS挥发性物质的原始谱图和标记挥发性物质数据;自建数据处理平台,使用Python 3.8.5软件对NIR、GC-IMS原始谱图数据和标记挥发性物质这3种类型数据,分别进行PCA、LDA降维,选择最优降维结果。应用Adaboost、DT、KNN、MLP、RF、SGD、SVM共计7种数据挖掘分类算法建立白牡丹等级判别模型。
2. 结果与分析
2.1 基于NIR技术的等级判别
2.1.1 NIR数据降维
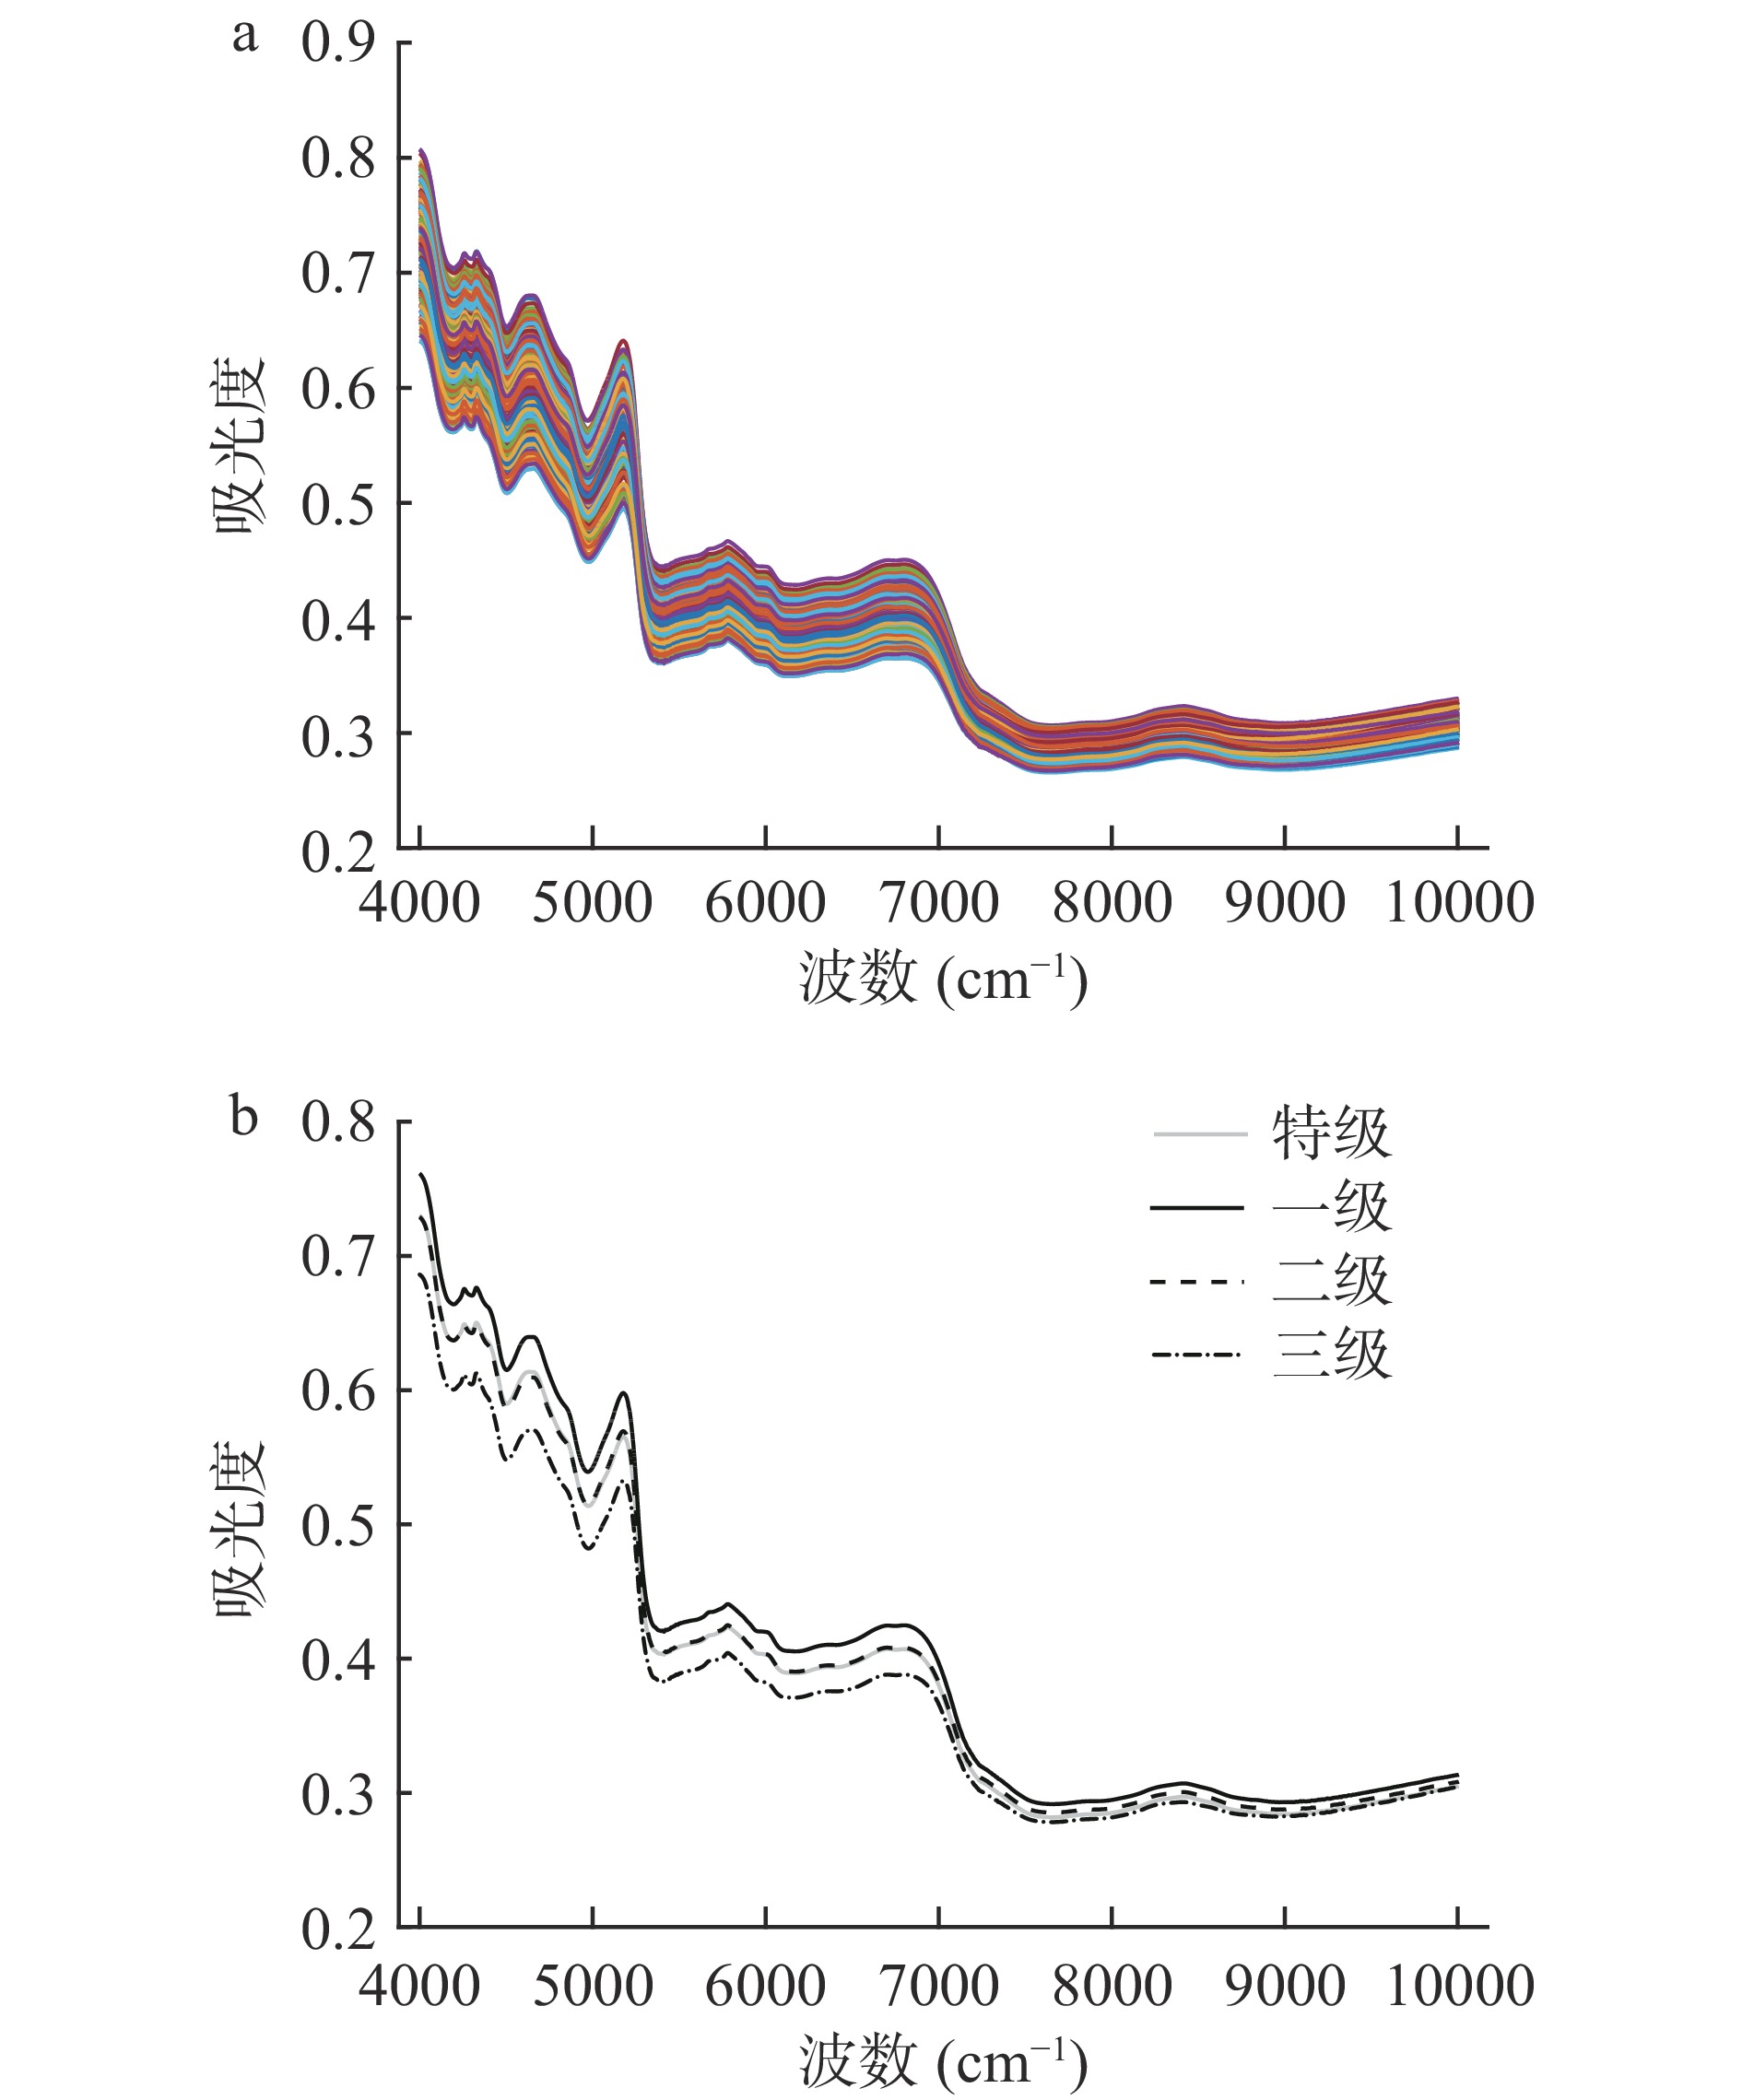
白牡丹茶的NIR原始谱图结果如图2所示。所有样本在4000~10000 cm−1波段的NIR光谱基本形态基本一致,吸光度值变化趋势相似;随着波数的增加,吸光度值总体呈现下降趋势,变化范围处于0.266~0.807之间;不同等级白牡丹的平均光谱如图2b所示,各等级白茶平均光谱间能基本分开,因此后续模型构建基于全谱段进行。
![]() 图 2 不同等级白牡丹近红外原始光谱图注:a为所有样品原始光谱图;b为4个等级样品的平均光谱图。Figure 2. Near infrared spectra of different grades of Bai Mudan white tea
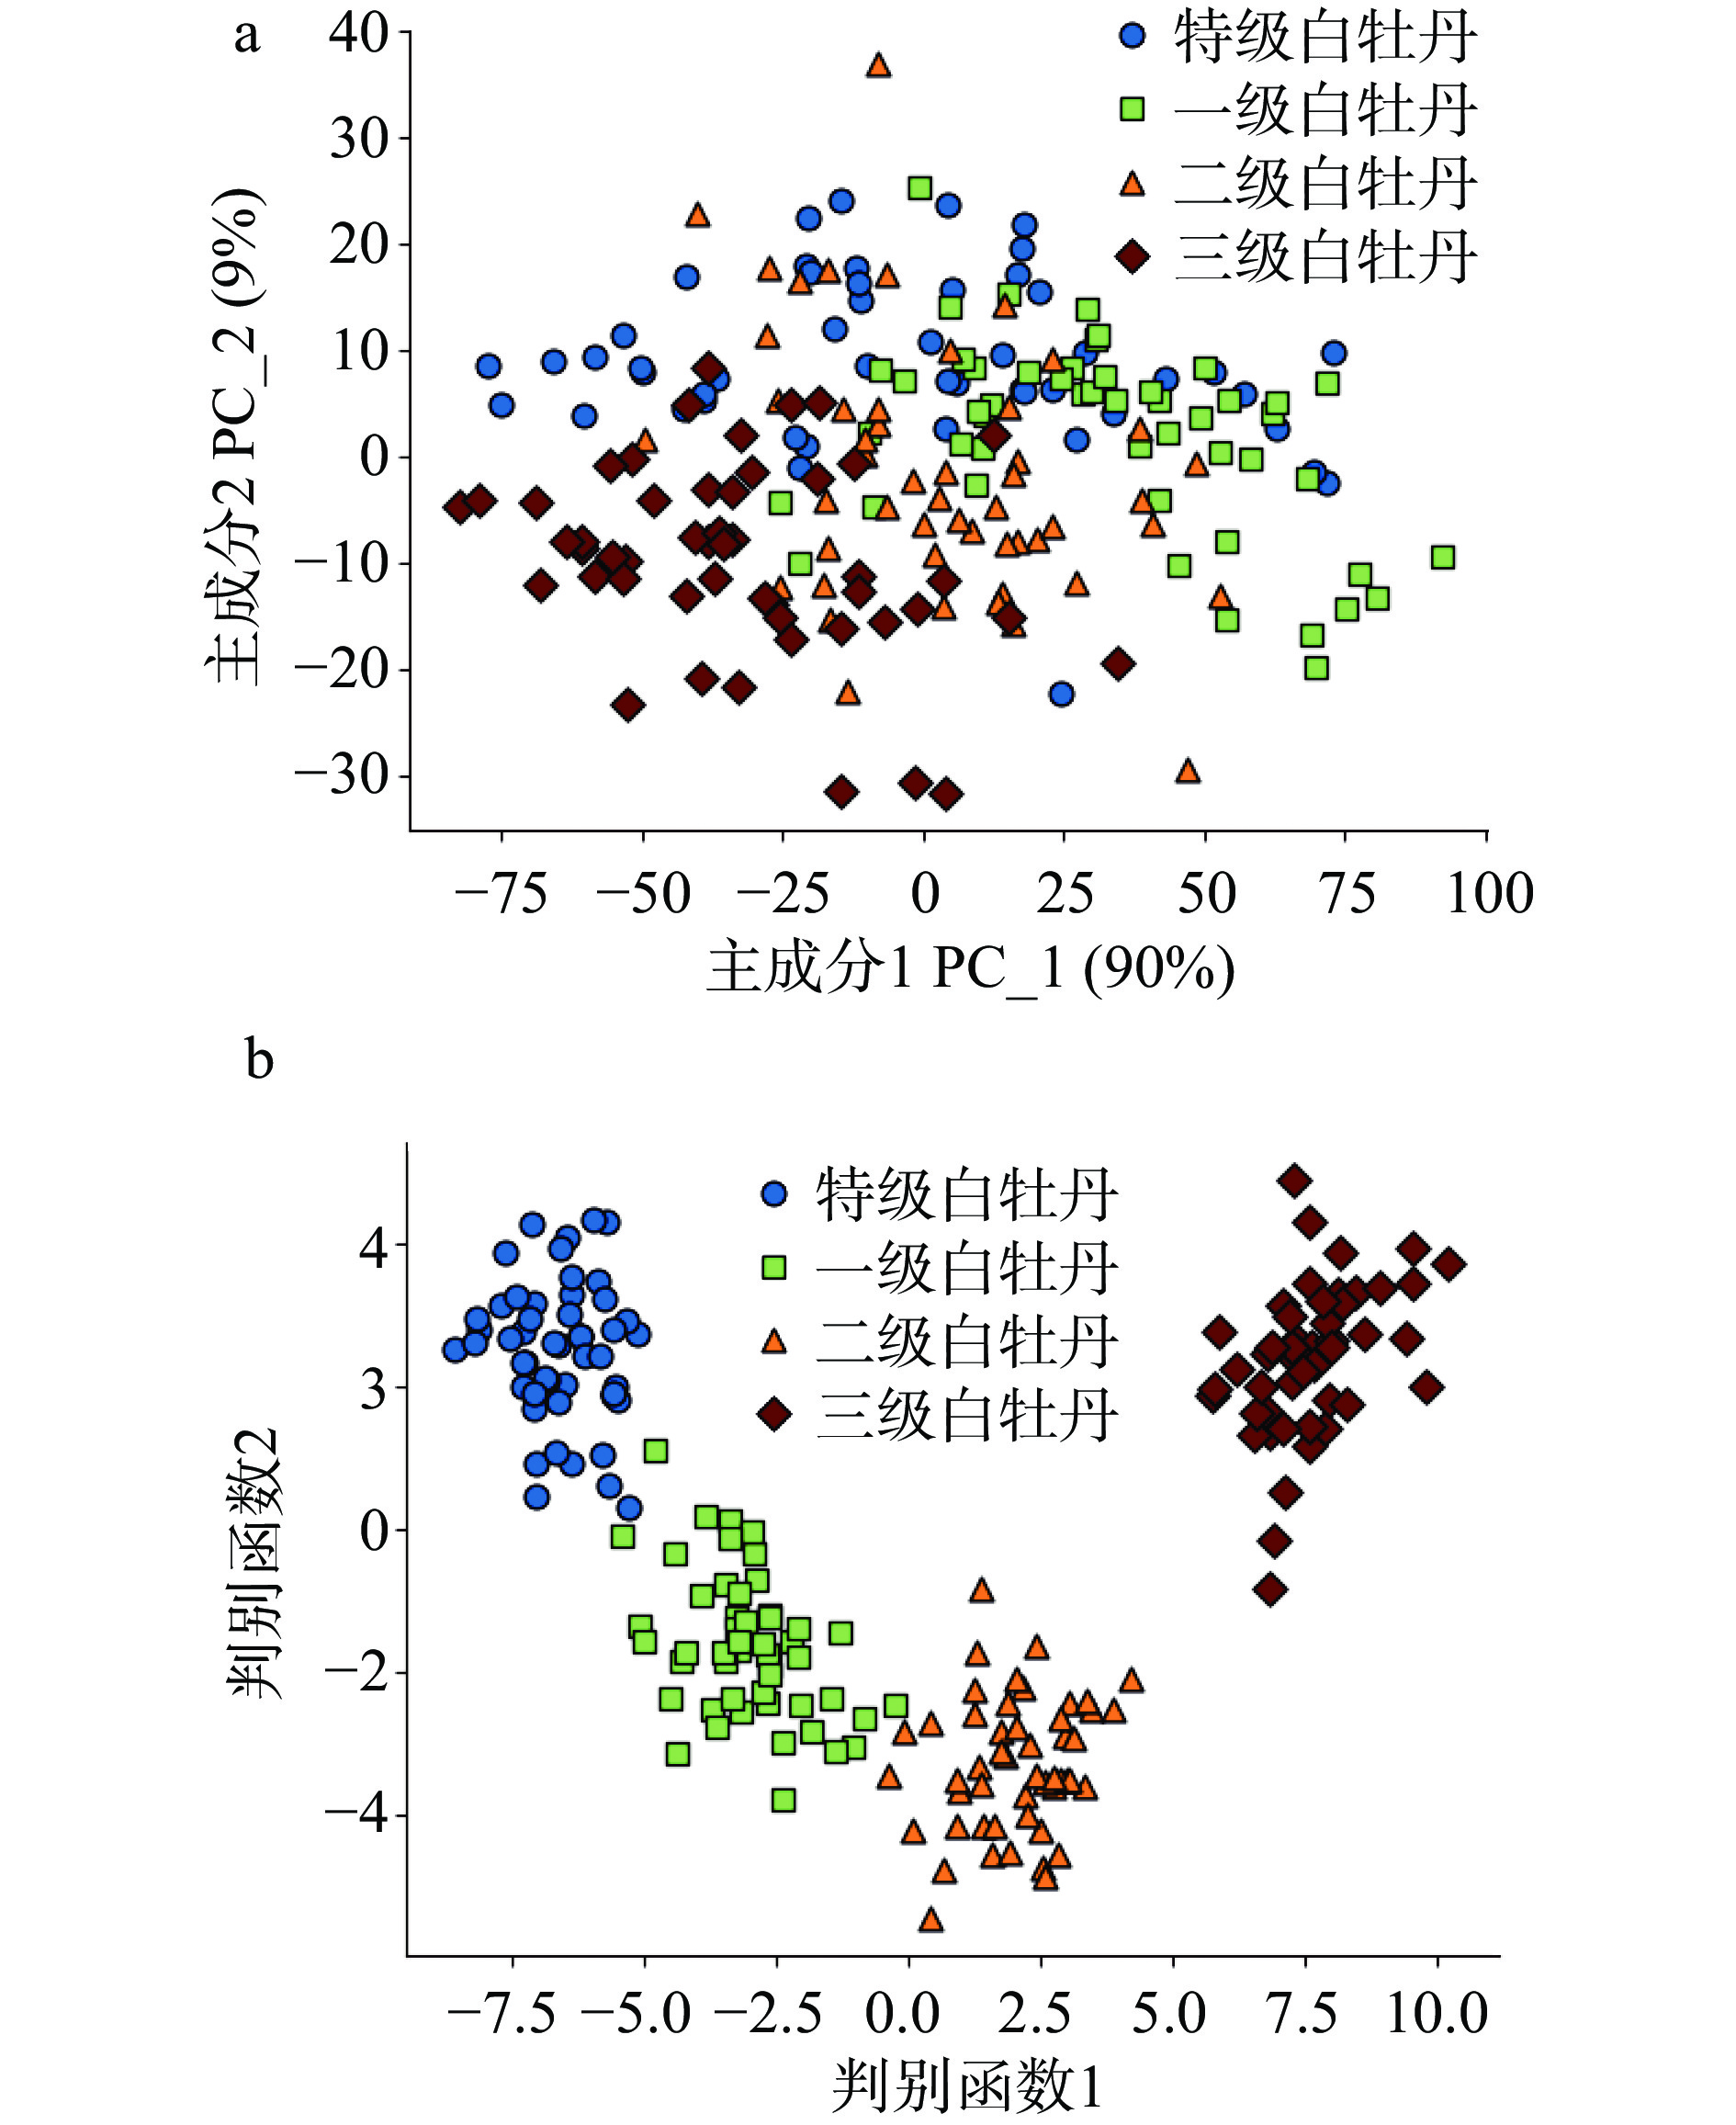
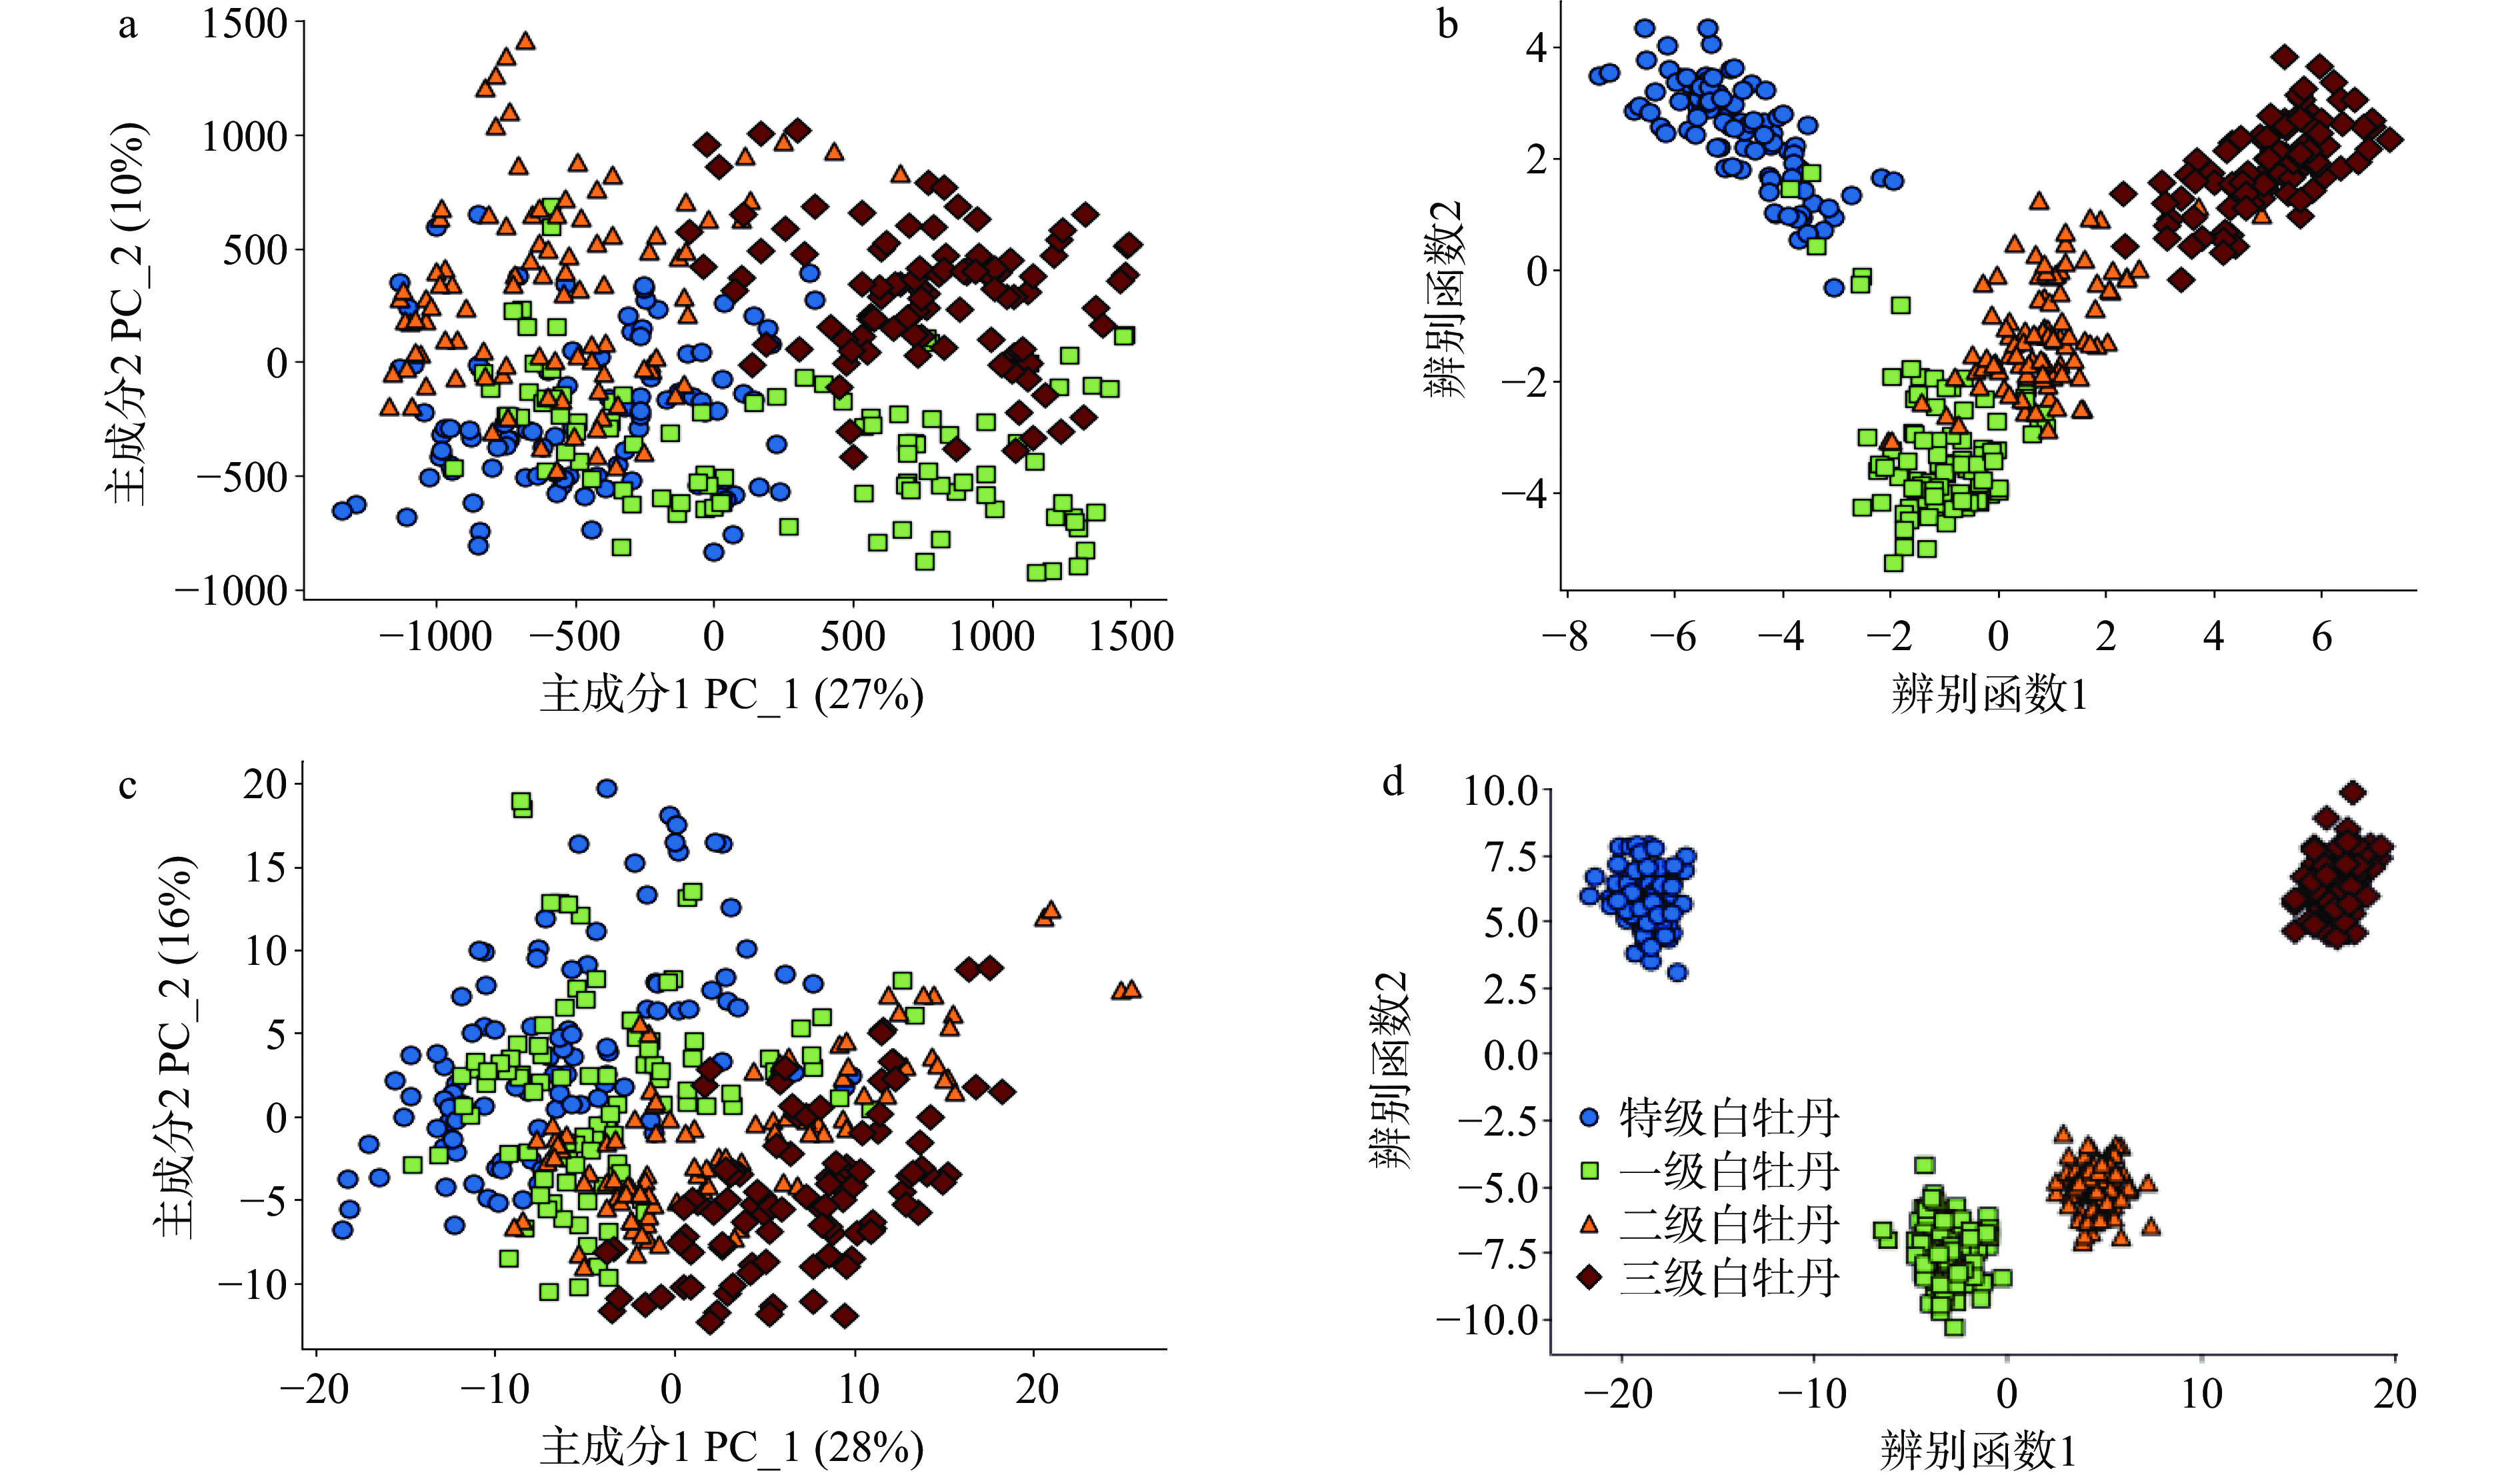
图 2 不同等级白牡丹近红外原始光谱图注:a为所有样品原始光谱图;b为4个等级样品的平均光谱图。Figure 2. Near infrared spectra of different grades of Bai Mudan white tea分别采用PCA和LDA进行数据降维,结果如图3所示,使用PCA降维,PC1、PC2累计贡献率为99%,各等级样品间的分布存在交叉重叠现象,不同等级间分离效果差;LDA降维后,不同等级间区分明显,其中三级白牡丹(最低等级)与其他3个等级的距离较远。LDA是一种有监督的特征提取方法,其原理是将所有样本点都投影到一个高维直线上,尽可能使同类各样本点的投影尽量地贴近,而不同类各样本点投影之间尽量分散地分布,即降维的同时还能进行分类[30];PCA是一种无监督的学习方法,其可以通过将数据投影到主成分上来降维,它的目的是使降维后的数据尽可能最大程度的保留原始数据的信息,但是它不能保证在降维后,新的低维空间中保留数据中是最具有判别性的信息。因此,LDA降维效果更佳,后续采用此法对NIR数据降维。
![]() 图 3 不同等级白牡丹近红外光谱数据降维结果注:a为PCA分析;b为LDA分析。Figure 3. Dimension reduction results of NIR data of different grades of Bai Mudan white tea
图 3 不同等级白牡丹近红外光谱数据降维结果注:a为PCA分析;b为LDA分析。Figure 3. Dimension reduction results of NIR data of different grades of Bai Mudan white tea2.1.2 基于NIR等级判别模型
按照3:1比例划分为训练集和测试集后,使用降维后的NIR数据建立等级判别模型(图4)。图中的虚线表示分类边界,即将样本分类的决策边界,当样本特征被映射到一个低维度空间中时,通过决策边界就可以划分不同的样本等级。所建的Adaboost、DT、KNN、MLP、RF、SGD和SVM模型中,测试集的识别正确率分别为94%、96%、98%、98%、98%和98%(表1),可见不同模型识别正确率均大于90%。核对误判样本发现,多数误判发生在特级、一级、二级的相邻等级之间,例如特级白牡丹被误判为一级白牡丹,一级白牡丹被误判为特级或二级白牡丹,不存在间级误判。特级、一级、二级的理化性质更相似、空间距离更接近,三级样本与其他等级的差异最为明显,因此模型误判主要发生在相邻等级之间。
![]() 表 1 基于近红外光谱数据白牡丹等级模型判别结果Table 1. Discrimination results of Bai Mudan white tea grade model based on NIR data
表 1 基于近红外光谱数据白牡丹等级模型判别结果Table 1. Discrimination results of Bai Mudan white tea grade model based on NIR data模型 等级 测试结果 训练集
识别
正确率
(%)测试集
识别
正确率
(%)AUC Su-BMD F-BMD Se-BMD T-BMD Adaboost Su-BMD 17 0 0 0 100 94 0.95 F-BMD 2 7 1 0 Se-BMD 0 0 8 0 T-BMD 0 0 0 15 DT Su-BMD 16 1 0 0 100 98 0.99 F-BMD 0 9 0 0 Se-BMD 0 0 15 0 T-BMD 0 0 0 9 KNN Su-BMD 17 0 0 0 100 96 0.97 F-BMD 1 8 1 0 Se-BMD 0 0 8 0 T-BMD 0 0 0 15 MLP Su-BMD 17 1 0 0 100 98 0.98 F-BMD 0 9 1 0 Se-BMD 0 0 8 0 T-BMD 0 0 0 15 RF Su-BMD 17 0 0 0 100 98 0.98 F-BMD 0 9 1 0 Se-BMD 0 0 8 0 T-BMD 0 0 0 15 SGD Su-BMD 17 0 0 0 100 98 0.98 F-BMD 0 9 1 0 Se-BMD 0 0 8 0 T-BMD 0 0 0 15 SVM Su-BMD 13 0 0 0 100 98 0.99 F-BMD 1 12 0 0 Se-BMD 0 0 12 0 T-BMD 0 0 0 12 注:AUC为受试者工作特征曲线下的面积,AUC值越大,模型性能越好,最佳理论值为1.0。 DT模型的变量数超过样本数(150个),产生数据过拟合现象(图4b),在一级和二级样本的区域划分超过2次,说明该模型不适用于当前白茶等级评价,后续可通过增加训练集数量、减少模型变量等方法避免数据过拟合。其余6种模型判别率在94%~98%之间,ROC曲线下的面积AUC均≥0.95,表明等级识别模型性能好,等级识别正确率高。
2.2 基于GC-IMS技术的等级判别
2.2.1 不同等级的白牡丹GC-IMS图谱
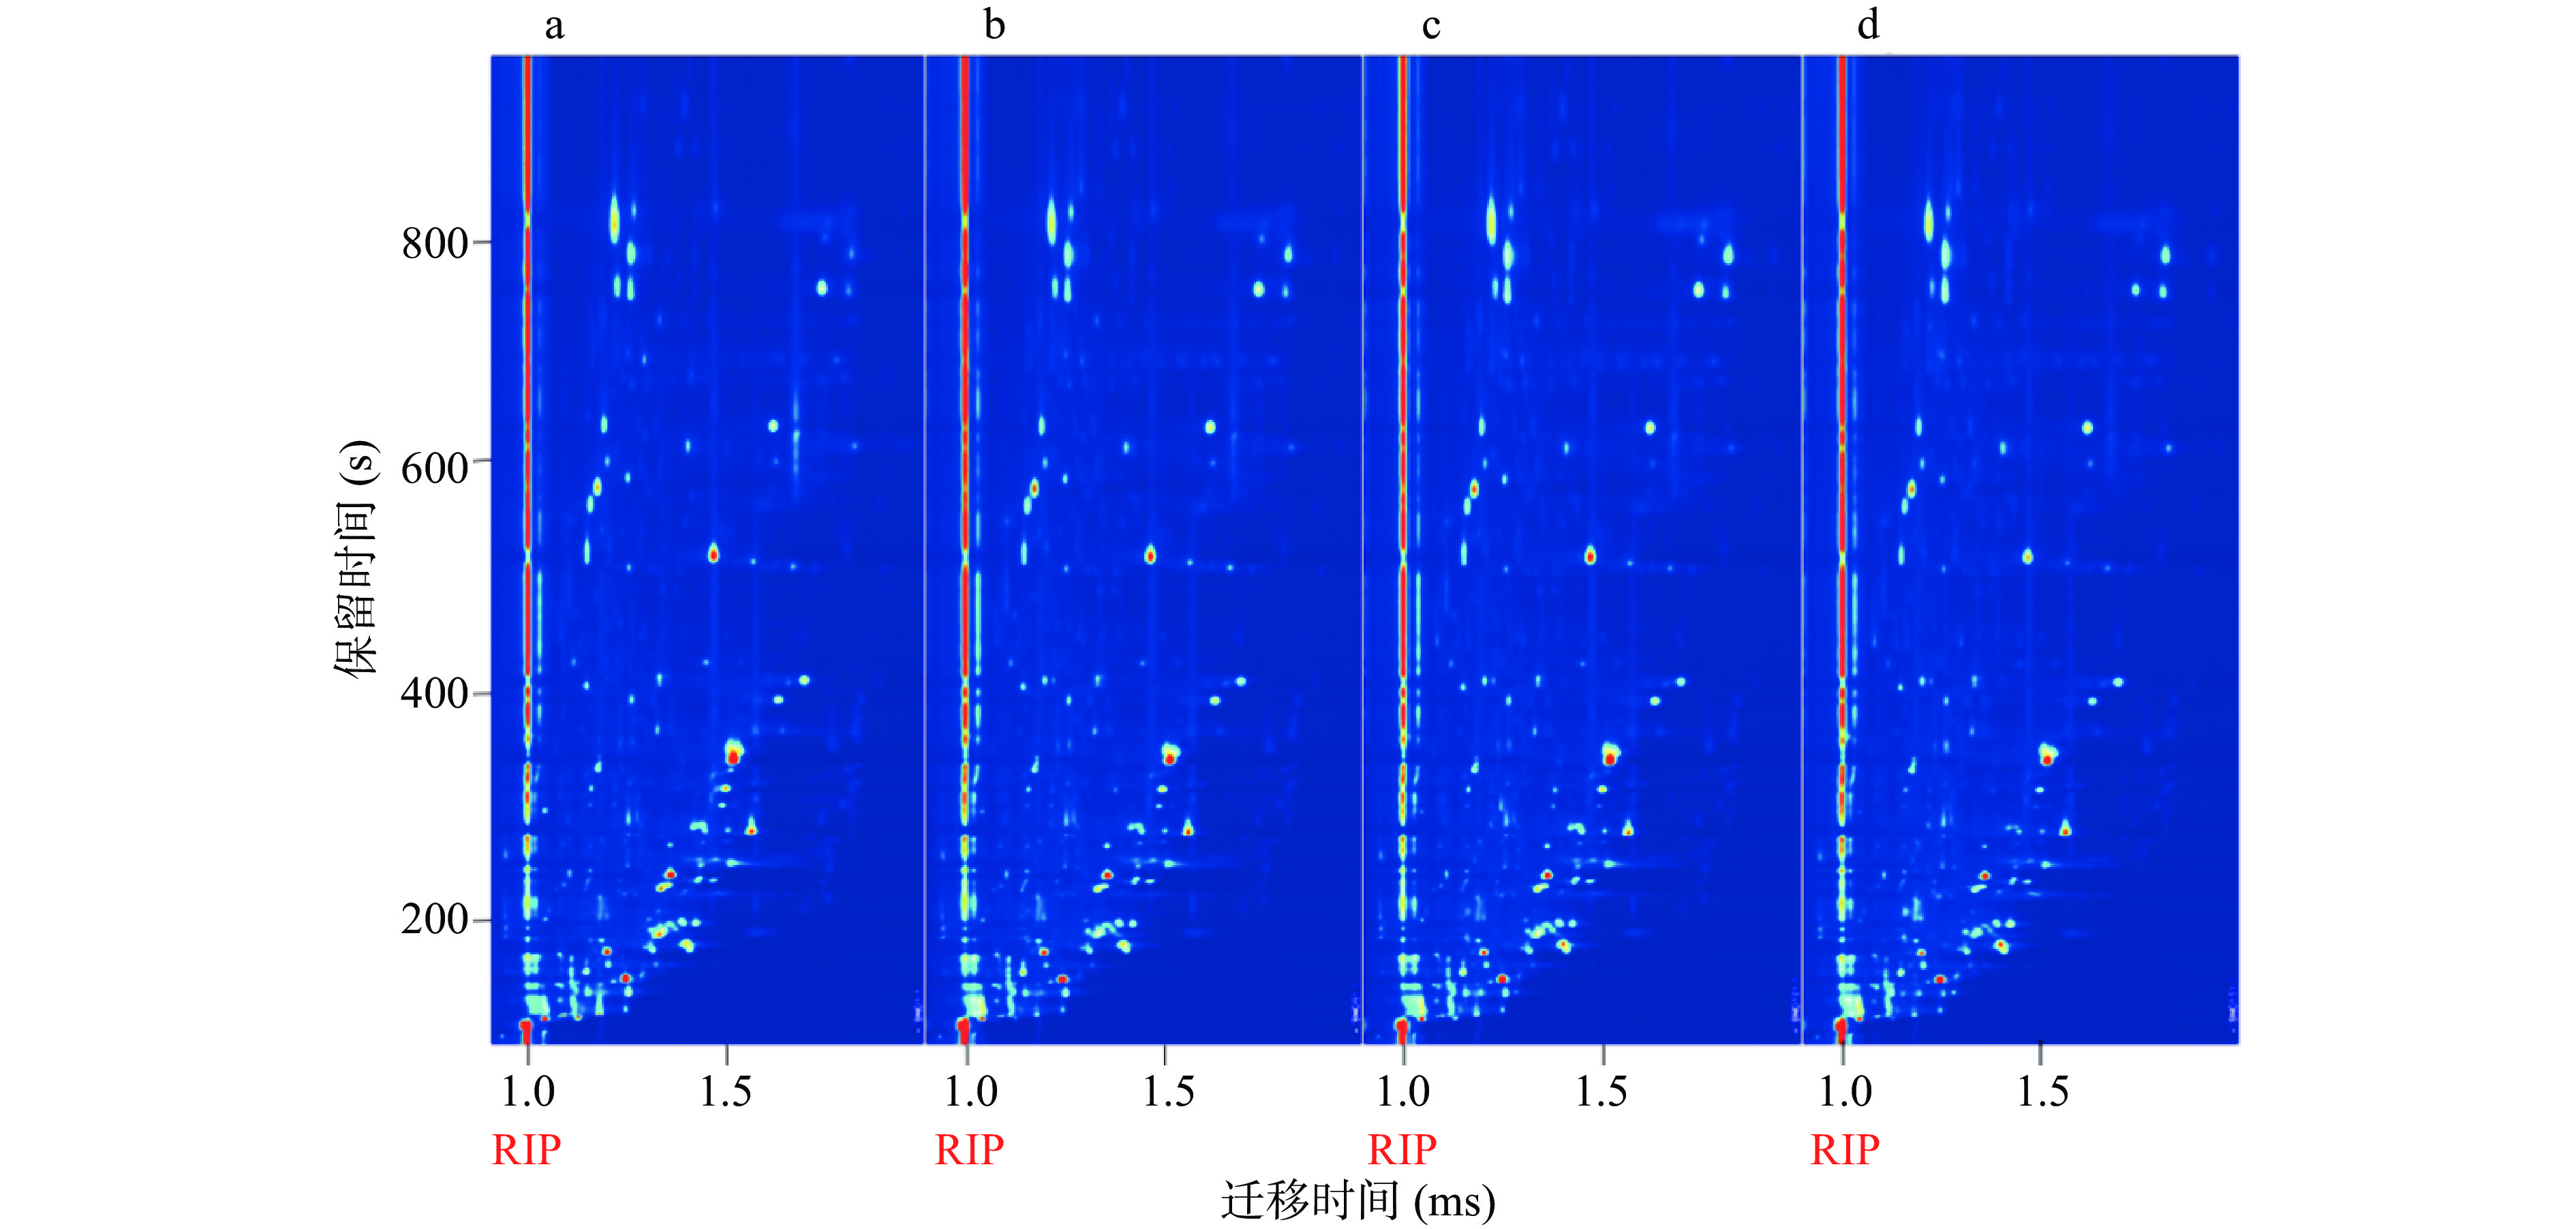
不同等级的白牡丹GC-IMS图谱经RIP归一化处理后如图5所示,大多数挥发性香气物质在保留时间110~830 s、迁移时间1.00~1.77 ms内得到有效分离。不同等级白牡丹的挥发性物质的组成基本相同,但在含量上存在差异。基于前期已有研究[29],使用LAV软件共标记了241种挥发性香气物质,并鉴定出41种挥发性香气物质。
![]() 图 5 不同等级白牡丹二维GC-IMS谱图注:a为特级白牡丹,b为一级白牡丹,c为二级白牡丹,d为三级白牡丹;背景为蓝色,红色表示该样品物质浓度较高,浅蓝色则表示该样品物质浓度较低;RIP表示反应离子峰。Figure 5. Two-dimensional spectra of GC-IMS in different grades of Bai Mudan white tea
图 5 不同等级白牡丹二维GC-IMS谱图注:a为特级白牡丹,b为一级白牡丹,c为二级白牡丹,d为三级白牡丹;背景为蓝色,红色表示该样品物质浓度较高,浅蓝色则表示该样品物质浓度较低;RIP表示反应离子峰。Figure 5. Two-dimensional spectra of GC-IMS in different grades of Bai Mudan white tea2.2.2 GC-IMS数据降维
以241种挥发性物质对应的特征峰峰高值为变量,对GC-IMS香气数据进行降维分析,图6a、图6c为GC-IMS香气数据的PCA降维结果,各等级样本分布存在交叉重叠现象;图6b、图6d中不同等级白牡丹各有聚类群,LDA等级区分效果优于PCA,基于标记物LDA等级区分效果优于筛选谱图数据的LDA等级区分。
![]() 图 6 不同等级白牡丹GC-IMS数据降维结果注:a为筛选谱图数据PCA分析,b为筛选谱图数据LDA分析,c为标记物质数据PCA分析,d为标记物质数据LDA分析。Figure 6. Dimension reduction results of GC-IMS data of different grades of Bai Mudan white tea
图 6 不同等级白牡丹GC-IMS数据降维结果注:a为筛选谱图数据PCA分析,b为筛选谱图数据LDA分析,c为标记物质数据PCA分析,d为标记物质数据LDA分析。Figure 6. Dimension reduction results of GC-IMS data of different grades of Bai Mudan white tea2.2.3 基于GC-IMS等级判别模型
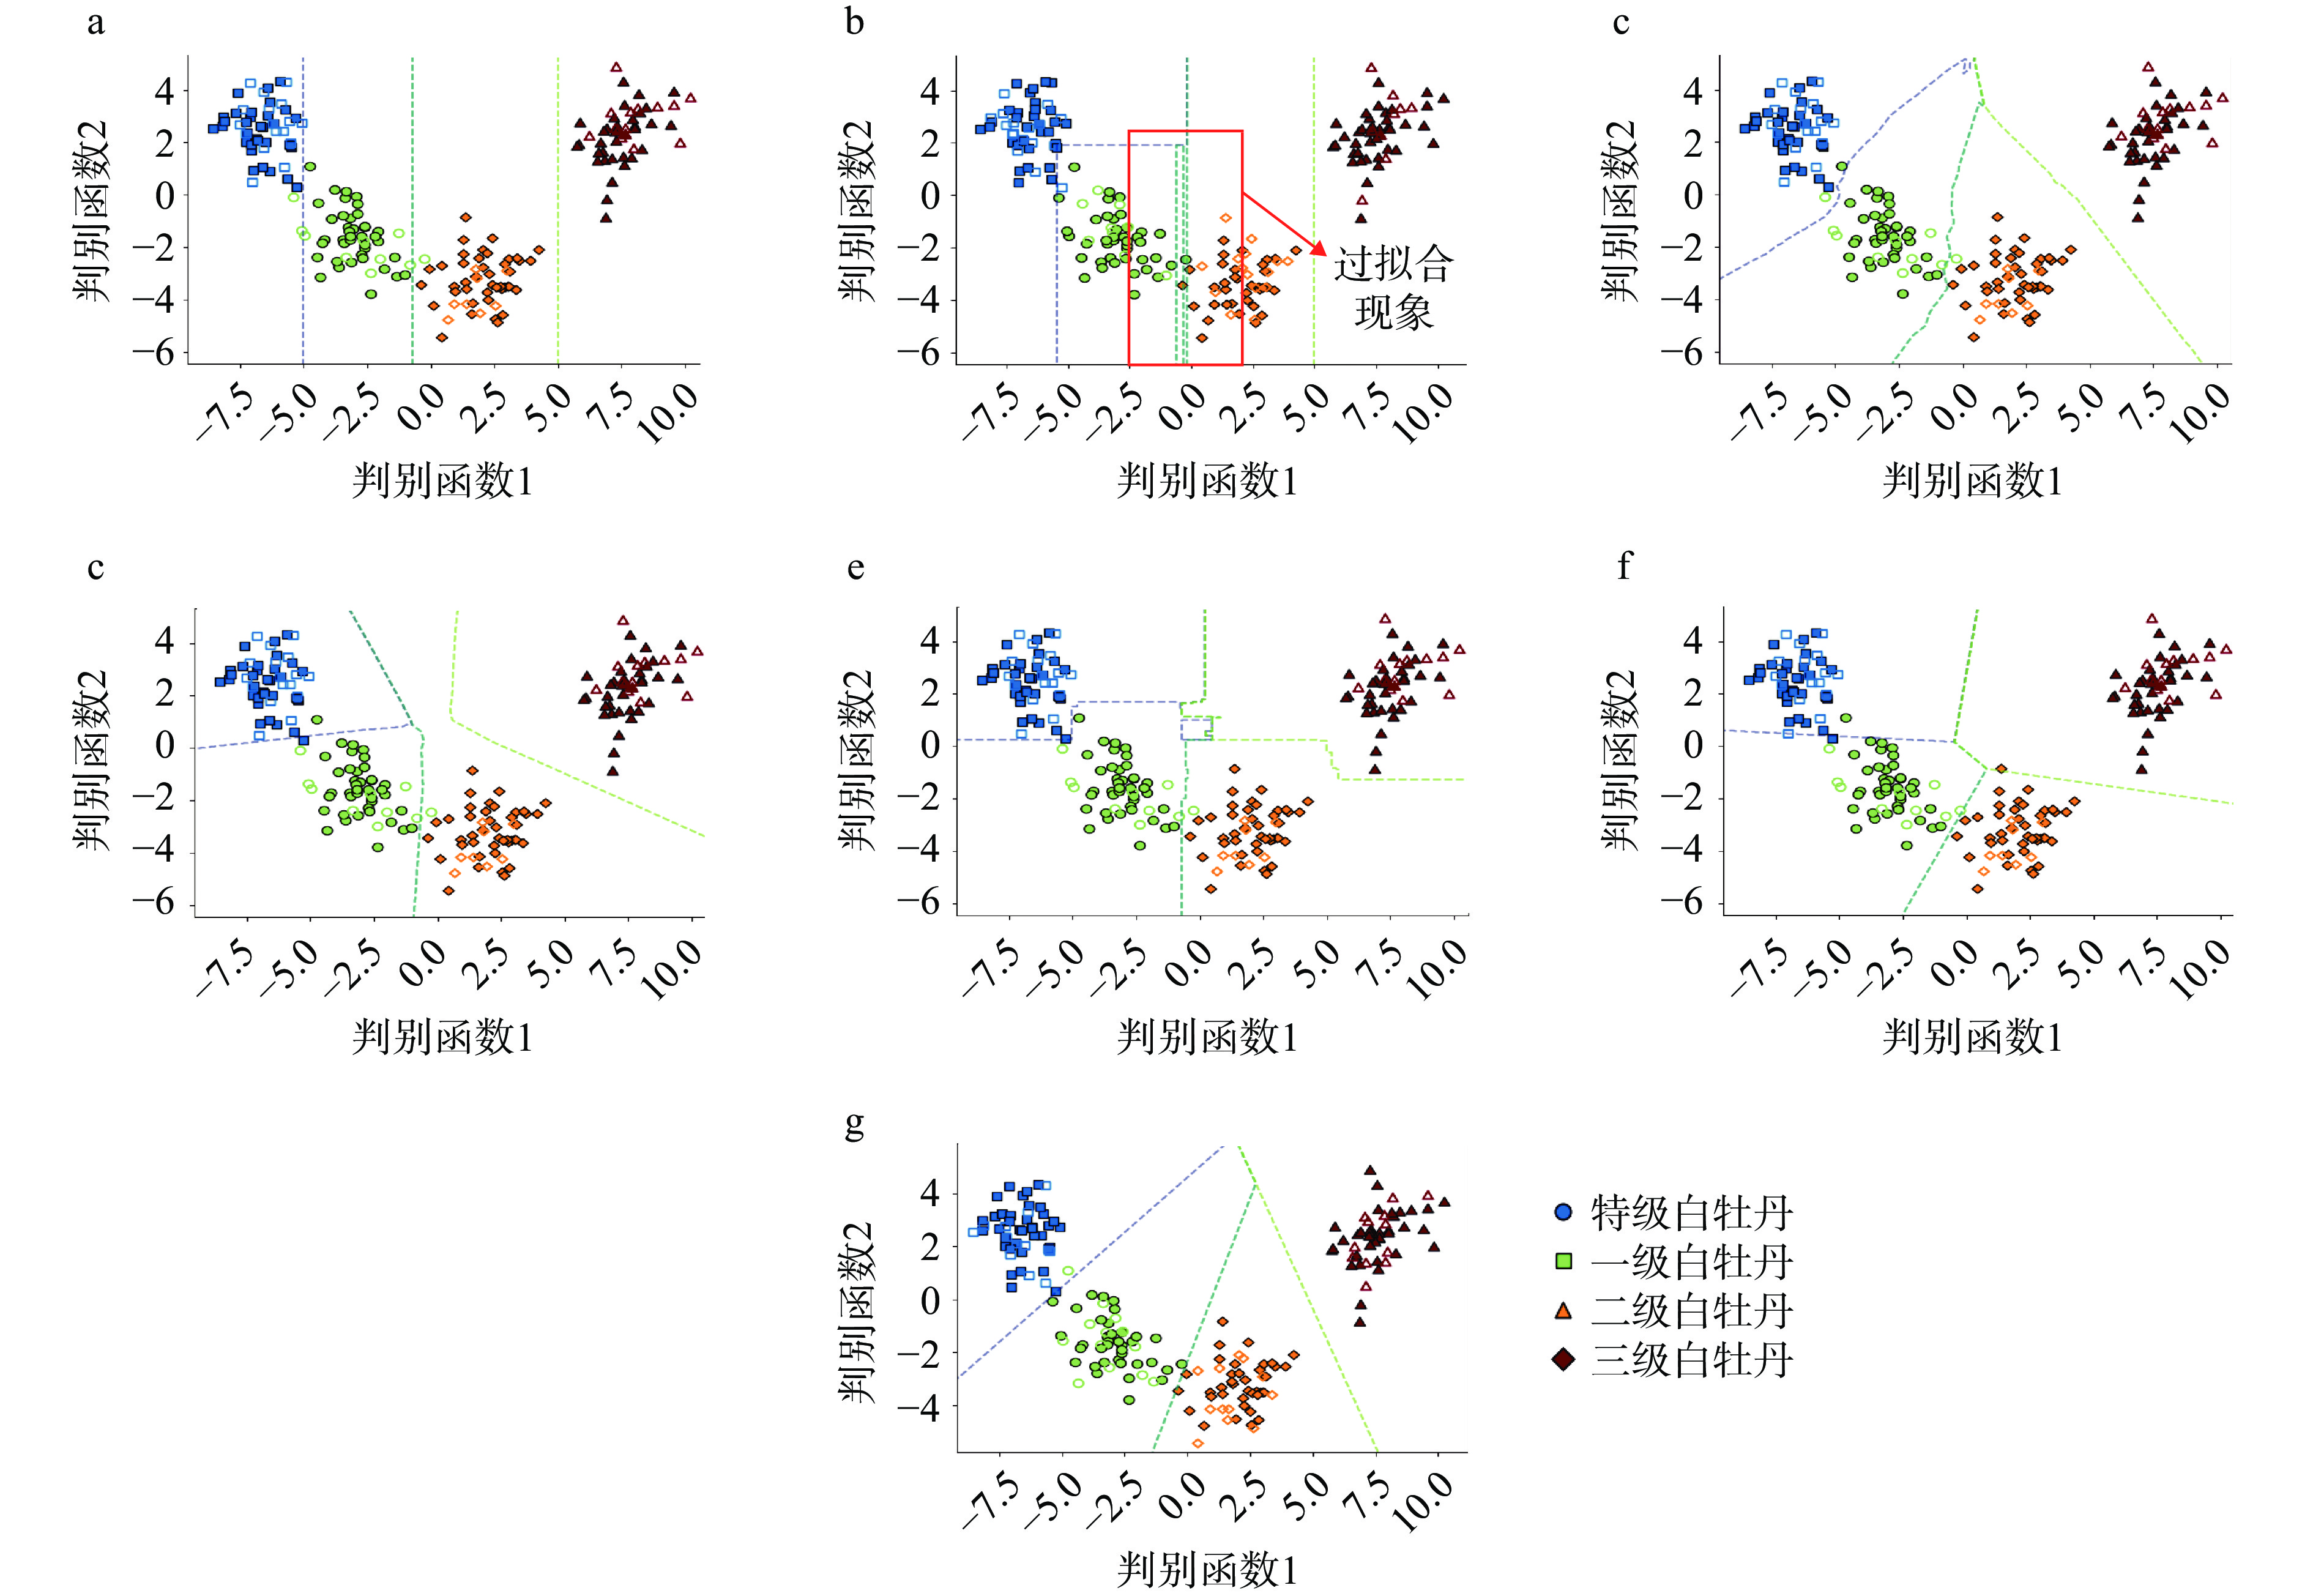
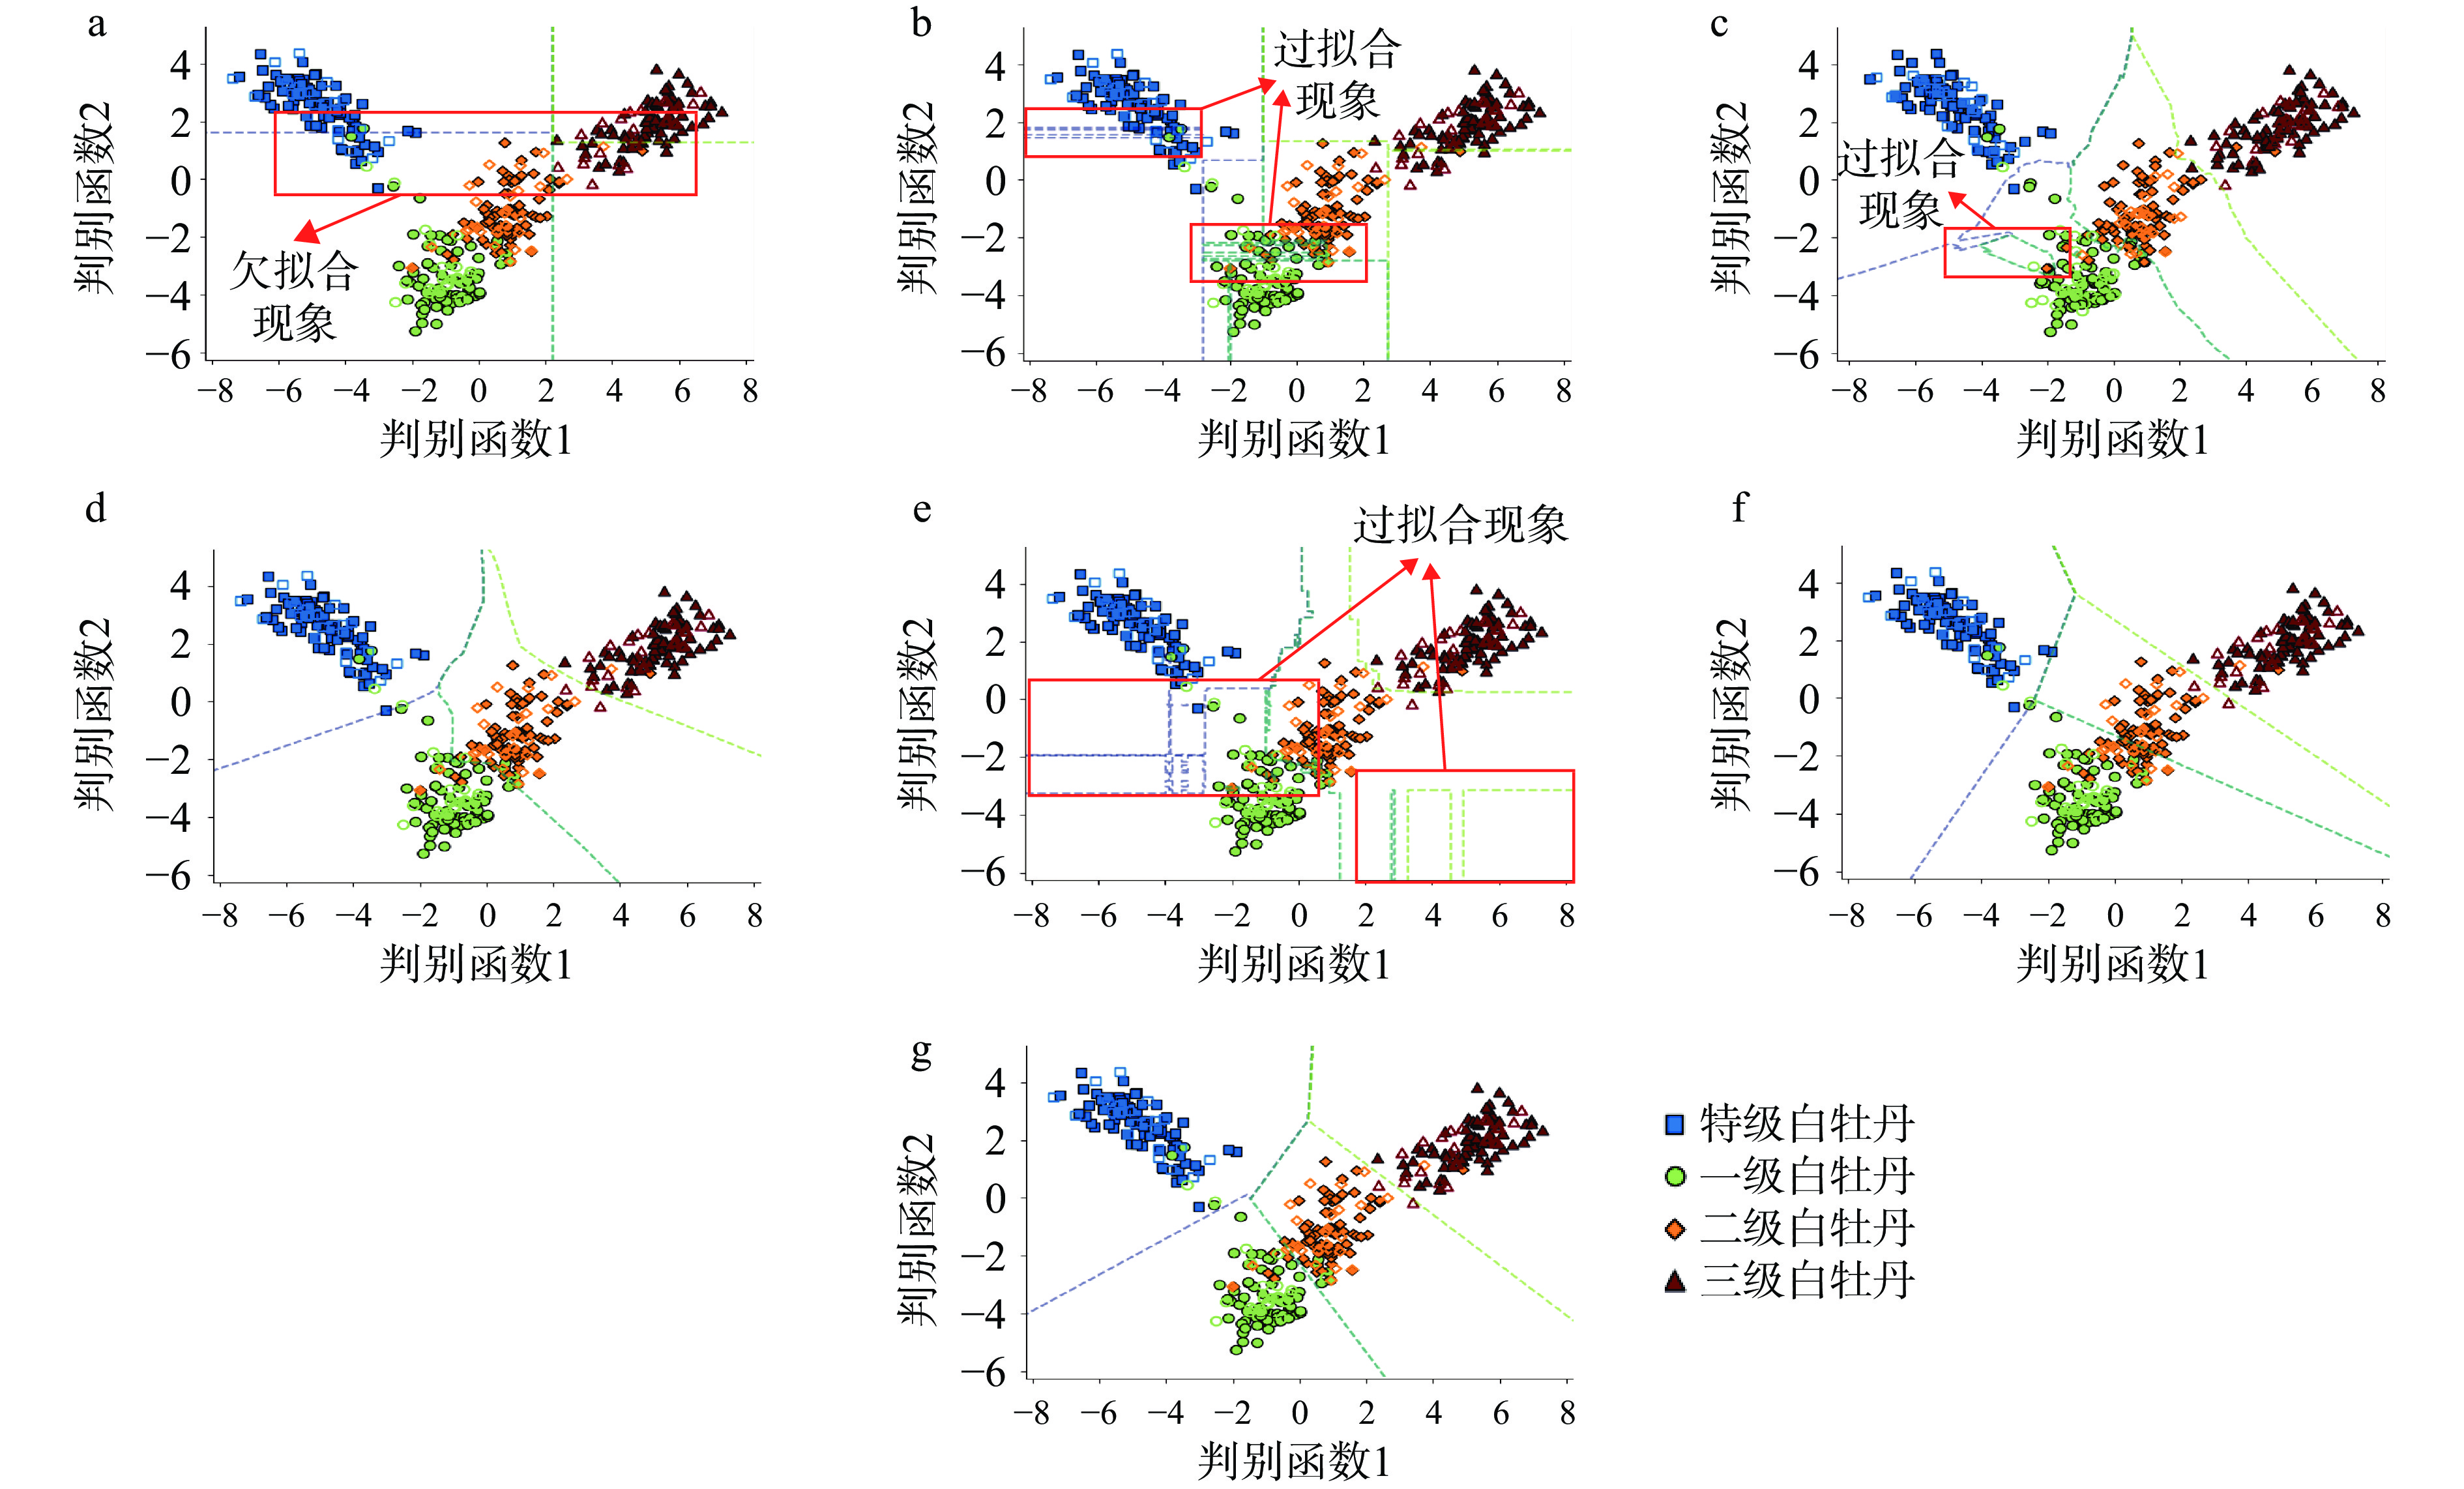
同2.1.1结论一致,LDA降维效果最佳,采用LDA对GC-IMS数据降维。基于筛选谱图数据和标记物质谱图两种数据,分别等级判别模型。将样本数据按照3:1比例划分训练集和测试集。将筛选谱图数据建立7种模型(图7),各模型的等级正判率分别为83%、92%、93%、92%、94%、91%和91%(表2)。如图7b、图7c、图7e所示,DT、KNN、RF模型的决策边界过于精确地对样品进行分类,泛化性不足,存在数据过拟合现象;Adaboost模型未能对样品进行分类,存在欠拟合现象。MLP、SGD和SVM模型的等级正判率在91%~94%之间、AUC为0.94~0.96,模型性能好,可用于等级评价。
![]() 图 7 基于GC-IMS筛选谱图数据的白牡丹等级判别模型注:a为Adaboost模型,b为DT模型,c为KNN模型,d为MLP模型,e为RF模型,f为SGD模型,g为SVM模型。Figure 7. Classification models of Bai Mudan white tea based on GC-IMS表 2 基于GC-IMS数据白牡丹等级模型判别结果Table 2. Discrimination results of Bai Mudan white tea grade model based on GC-IMS data
图 7 基于GC-IMS筛选谱图数据的白牡丹等级判别模型注:a为Adaboost模型,b为DT模型,c为KNN模型,d为MLP模型,e为RF模型,f为SGD模型,g为SVM模型。Figure 7. Classification models of Bai Mudan white tea based on GC-IMS表 2 基于GC-IMS数据白牡丹等级模型判别结果Table 2. Discrimination results of Bai Mudan white tea grade model based on GC-IMS data数据
类型模型
类型等级 测试数据 训练集识别
正确率(%)测试集识别
正确率(%)AUC Su-BMD F-BMD Se-BMD T-BMD 筛选谱
图数据Adaboost Su-BMD 20 3 0 0 100 83 0.89 F-BMD 1 19 4 0 Se-BMD 0 1 24 1 T-BMD 0 0 7 20 DT Su-BMD 22 1 0 0 100 92 0.95 F-BMD 1 22 1 0 Se-BMD 0 3 22 1 T-BMD 0 0 1 26 KNN Su-BMD 25 0 0 0 100 93 0.95 F-BMD 1 22 2 0 Se-BMD 0 3 21 1 T-BMD 0 0 0 25 MLP Su-BMD 23 0 0 0 100 92 0.95 F-BMD 2 21 1 0 Se-BMD 0 2 23 1 T-BMD 0 0 2 25 RF Su-BMD 23 0 0 0 100 94 0.96 F-BMD 1 22 1 0 Se-BMD 0 2 23 1 T-BMD 0 0 1 26 SGD Su-BMD 23 0 0 0 100 91 0.94 F-BMD 2 21 1 0 Se-BMD 0 2 23 1 T-BMD 0 0 3 24 SVM Su-BMD 23 0 0 0 100 91 0.94 F-BMD 2 21 1 0 Se-BMD 0 3 22 1 T-BMD 0 0 2 25 标记物质
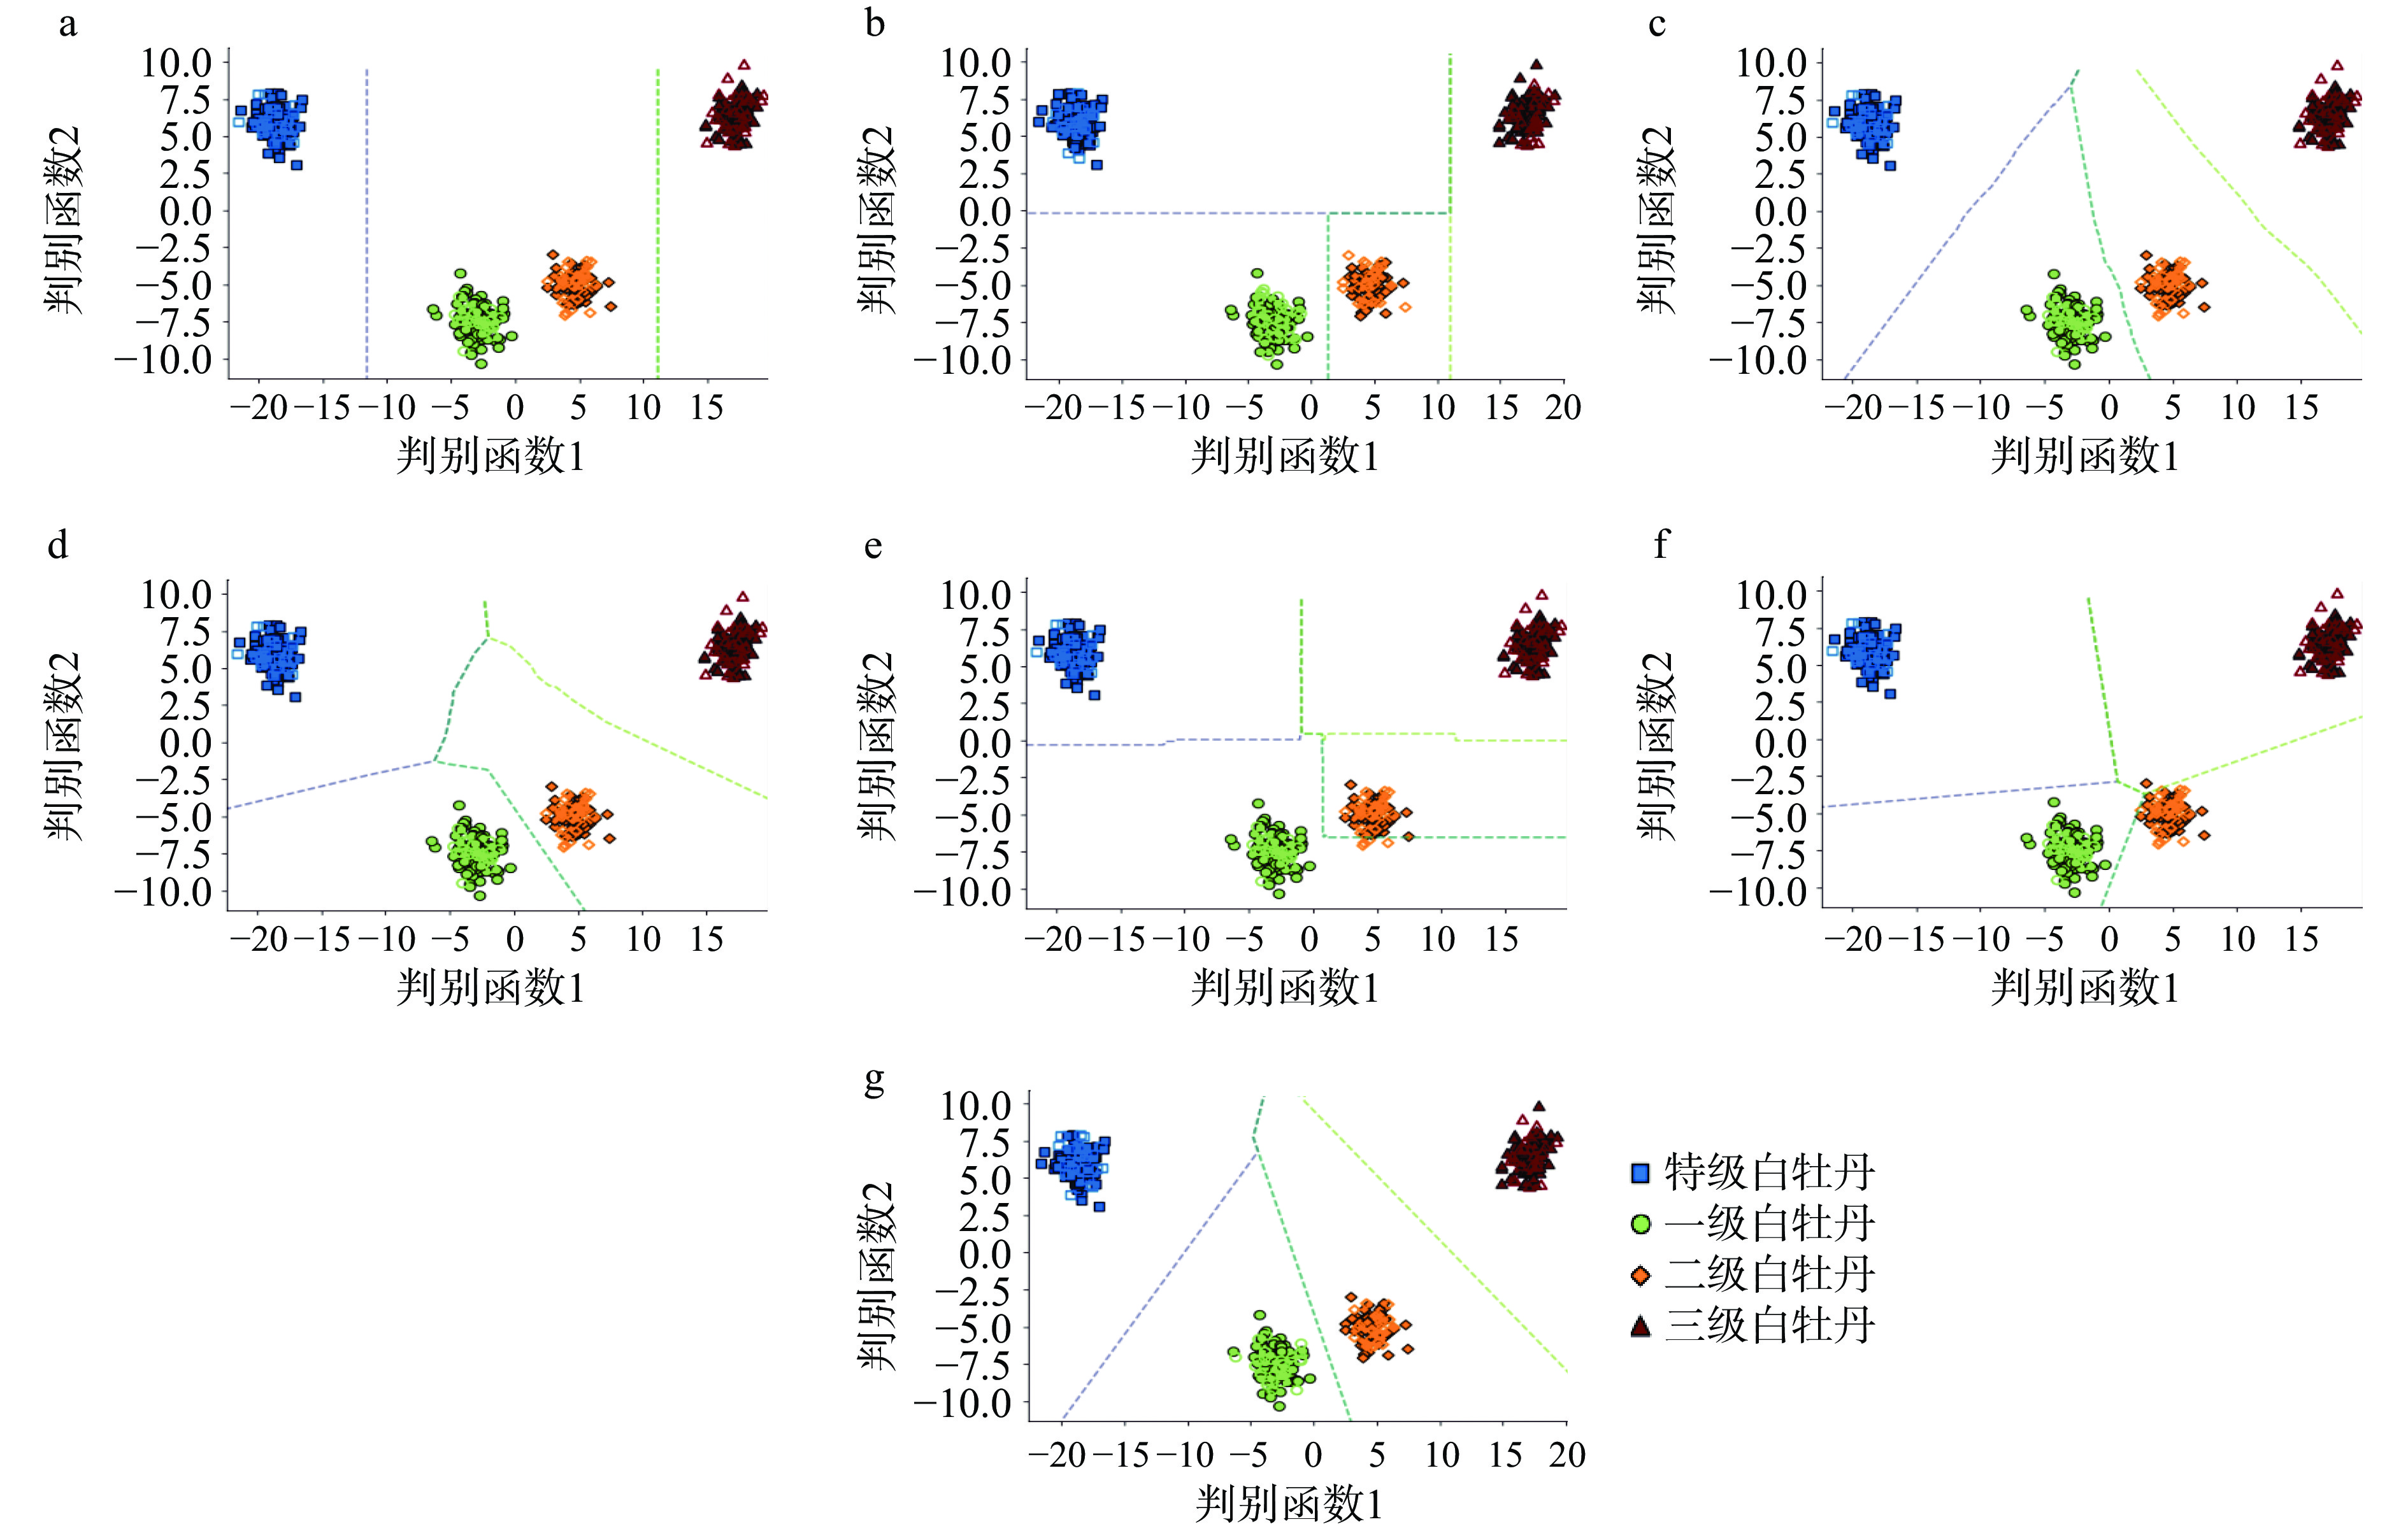
数据Adaboost Su-BMD 23 0 0 0 100 100 1.00 F-BMD 0 19 0 0 Se-BMD 0 0 30 0 T-BMD 0 0 0 28 DT Su-BMD 24 0 0 0 100 100 1.00 F-BMD 0 27 0 0 Se-BMD 0 0 26 0 T-BMD 0 0 0 23 KNN Su-BMD 23 0 0 0 100 100 1.00 F-BMD 0 19 0 0 Se-BMD 0 0 30 0 T-BMD 0 0 0 28 MLP Su-BMD 23 0 0 0 100 100 1.00 F-BMD 0 19 0 0 Se-BMD 0 0 30 0 T-BMD 0 0 0 28 RF Su-BMD 23 0 0 0 100 96 0.98 F-BMD 0 19 0 0 Se-BMD 0 4 26 0 T-BMD 0 0 0 28 SGD Su-BMD 23 0 0 0 100 100 1.00 F-BMD 0 19 0 0 Se-BMD 0 0 30 0 T-BMD 0 0 0 28 SVM Su-BMD 25 0 0 0 100 100 1.00 F-BMD 0 25 0 0 Se-BMD 0 0 25 0 T-BMD 0 0 0 25 注:AUC为受试者工作特征曲线下的面积,AUC值越大,模型性能越好。 同样,基于241种标记挥发性物质的峰强度值数据,建立等级判别模型(图8)。241种标记挥发物的等级判别模型,不同等级之间相互区分,单独聚集。如表2所示,除RF模型等级识别率为96%、ROC曲线下的面积AUC为0.98,其余6种模型等级识别率为100%、AUC均为1.0。GC-IMS的241种标记物质数据筛选可用于区分白牡丹等级,7种分类器算法均表现出优越的模型性能。
![]() 图 8 基于GC-IMS标记物质的白牡丹等级判别模型注:a为Adaboost模型,b为DT模型,c为KNN模型,d为MLP模型,e为RF模型,f为SGD模型,g为SVM模型。Figure 8. Classification models of Bai Mudan white tea based on GC-IMS marked volatiles
图 8 基于GC-IMS标记物质的白牡丹等级判别模型注:a为Adaboost模型,b为DT模型,c为KNN模型,d为MLP模型,e为RF模型,f为SGD模型,g为SVM模型。Figure 8. Classification models of Bai Mudan white tea based on GC-IMS marked volatiles综上,GC-IMS采集的挥发性化学物特征数据库能够用于建立白茶等级判别模型。无论是基于筛选谱图数据还是标记挥发性物质数据,都能建立等级识别率>90%,AUC>0.9的等级判别模型。标记挥发物质的等级模型性能优异,判别效果优于筛选谱图的等级模型。
3. 结论
本研究建立了16个高质量白牡丹等级判别模型,证实了NIR、GC-IMS结合数据挖掘分类器算法用于白茶等级快速、简单识别的可行性,在茶叶等级鉴别和质量控制方法的选择上向前迈进了一步。为了减少实际应用中,模型对数据预处理方法、波长、样本背景等客观因素的依赖,进一步提高模型的性能和鲁棒性[31],后期将继续探索使用以多模型融合深度学习模型,该方法已在白茶产地溯源中应用[32]。将茶叶品质智能评价模型从传统单一的机器学习模型转入多模型融合的深度学习模型[33−35],是未来智能茶产业和智能农业的发展趋势。除此外,后续将尝试利用互联网技术,基于所建的高质量白茶等级判别模型,建设在线判别平台,实现远程白茶等级判别,既能丰富和完善数据库,也能进一步提升模型质量。
-
![]()
图 1 四个等级白牡丹(白茶)的干茶、叶底和茶汤
注:a为特级白牡丹,b为一级白牡丹,c为二级白牡丹,d为三级白牡丹;i为干茶,ii为叶底,iii为茶汤。
Figure 1. Dry leaves, infused leaves and the brewing of Bai Mudan white tea from four grades
![]()
图 2 不同等级白牡丹近红外原始光谱图
注:a为所有样品原始光谱图;b为4个等级样品的平均光谱图。
Figure 2. Near infrared spectra of different grades of Bai Mudan white tea
![]()
图 3 不同等级白牡丹近红外光谱数据降维结果
注:a为PCA分析;b为LDA分析。
Figure 3. Dimension reduction results of NIR data of different grades of Bai Mudan white tea
![]()
![]()
图 5 不同等级白牡丹二维GC-IMS谱图
注:a为特级白牡丹,b为一级白牡丹,c为二级白牡丹,d为三级白牡丹;背景为蓝色,红色表示该样品物质浓度较高,浅蓝色则表示该样品物质浓度较低;RIP表示反应离子峰。
Figure 5. Two-dimensional spectra of GC-IMS in different grades of Bai Mudan white tea
![]()
图 6 不同等级白牡丹GC-IMS数据降维结果
注:a为筛选谱图数据PCA分析,b为筛选谱图数据LDA分析,c为标记物质数据PCA分析,d为标记物质数据LDA分析。
Figure 6. Dimension reduction results of GC-IMS data of different grades of Bai Mudan white tea
![]()
图 7 基于GC-IMS筛选谱图数据的白牡丹等级判别模型
注:a为Adaboost模型,b为DT模型,c为KNN模型,d为MLP模型,e为RF模型,f为SGD模型,g为SVM模型。
Figure 7. Classification models of Bai Mudan white tea based on GC-IMS
![]()
图 8 基于GC-IMS标记物质的白牡丹等级判别模型
注:a为Adaboost模型,b为DT模型,c为KNN模型,d为MLP模型,e为RF模型,f为SGD模型,g为SVM模型。
Figure 8. Classification models of Bai Mudan white tea based on GC-IMS marked volatiles
表 1 基于近红外光谱数据白牡丹等级模型判别结果
Table 1 Discrimination results of Bai Mudan white tea grade model based on NIR data
模型 等级 测试结果 训练集
识别
正确率
(%)测试集
识别
正确率
(%)AUC Su-BMD F-BMD Se-BMD T-BMD Adaboost Su-BMD 17 0 0 0 100 94 0.95 F-BMD 2 7 1 0 Se-BMD 0 0 8 0 T-BMD 0 0 0 15 DT Su-BMD 16 1 0 0 100 98 0.99 F-BMD 0 9 0 0 Se-BMD 0 0 15 0 T-BMD 0 0 0 9 KNN Su-BMD 17 0 0 0 100 96 0.97 F-BMD 1 8 1 0 Se-BMD 0 0 8 0 T-BMD 0 0 0 15 MLP Su-BMD 17 1 0 0 100 98 0.98 F-BMD 0 9 1 0 Se-BMD 0 0 8 0 T-BMD 0 0 0 15 RF Su-BMD 17 0 0 0 100 98 0.98 F-BMD 0 9 1 0 Se-BMD 0 0 8 0 T-BMD 0 0 0 15 SGD Su-BMD 17 0 0 0 100 98 0.98 F-BMD 0 9 1 0 Se-BMD 0 0 8 0 T-BMD 0 0 0 15 SVM Su-BMD 13 0 0 0 100 98 0.99 F-BMD 1 12 0 0 Se-BMD 0 0 12 0 T-BMD 0 0 0 12 注:AUC为受试者工作特征曲线下的面积,AUC值越大,模型性能越好,最佳理论值为1.0。  下载: 导出CSV
表 2 基于GC-IMS数据白牡丹等级模型判别结果
Table 2 Discrimination results of Bai Mudan white tea grade model based on GC-IMS data
数据
类型模型
类型等级 测试数据 训练集识别
正确率(%)测试集识别
正确率(%)AUC Su-BMD F-BMD Se-BMD T-BMD 筛选谱
图数据Adaboost Su-BMD 20 3 0 0 100 83 0.89 F-BMD 1 19 4 0 Se-BMD 0 1 24 1 T-BMD 0 0 7 20 DT Su-BMD 22 1 0 0 100 92 0.95 F-BMD 1 22 1 0 Se-BMD 0 3 22 1 T-BMD 0 0 1 26 KNN Su-BMD 25 0 0 0 100 93 0.95 F-BMD 1 22 2 0 Se-BMD 0 3 21 1 T-BMD 0 0 0 25 MLP Su-BMD 23 0 0 0 100 92 0.95 F-BMD 2 21 1 0 Se-BMD 0 2 23 1 T-BMD 0 0 2 25 RF Su-BMD 23 0 0 0 100 94 0.96 F-BMD 1 22 1 0 Se-BMD 0 2 23 1 T-BMD 0 0 1 26 SGD Su-BMD 23 0 0 0 100 91 0.94 F-BMD 2 21 1 0 Se-BMD 0 2 23 1 T-BMD 0 0 3 24 SVM Su-BMD 23 0 0 0 100 91 0.94 F-BMD 2 21 1 0 Se-BMD 0 3 22 1 T-BMD 0 0 2 25 标记物质
数据Adaboost Su-BMD 23 0 0 0 100 100 1.00 F-BMD 0 19 0 0 Se-BMD 0 0 30 0 T-BMD 0 0 0 28 DT Su-BMD 24 0 0 0 100 100 1.00 F-BMD 0 27 0 0 Se-BMD 0 0 26 0 T-BMD 0 0 0 23 KNN Su-BMD 23 0 0 0 100 100 1.00 F-BMD 0 19 0 0 Se-BMD 0 0 30 0 T-BMD 0 0 0 28 MLP Su-BMD 23 0 0 0 100 100 1.00 F-BMD 0 19 0 0 Se-BMD 0 0 30 0 T-BMD 0 0 0 28 RF Su-BMD 23 0 0 0 100 96 0.98 F-BMD 0 19 0 0 Se-BMD 0 4 26 0 T-BMD 0 0 0 28 SGD Su-BMD 23 0 0 0 100 100 1.00 F-BMD 0 19 0 0 Se-BMD 0 0 30 0 T-BMD 0 0 0 28 SVM Su-BMD 25 0 0 0 100 100 1.00 F-BMD 0 25 0 0 Se-BMD 0 0 25 0 T-BMD 0 0 0 25 注:AUC为受试者工作特征曲线下的面积,AUC值越大,模型性能越好。
下载: 导出CSV
-
[1] 梅宇, 林璇. 2017中国白茶产销形势分析报告[J]. 福建茶叶,2017,39(9):3−5 doi: 10.3969/j.issn.1005-2291.2017.09.002 MEI Y, LIN X. China white tea production and marketing situation analysis report in 2017[J]. Tea in Fujian,2017,39(9):3−5. doi: 10.3969/j.issn.1005-2291.2017.09.002
[2] 梅宇, 王智超. 2015全国春茶产销形势分析报告[J]. 广东茶业,2015,3:23−28 doi: 10.3969/j.issn.1672-7398.2015.03.008 MEI Y, WANG Z C. National spring tea production and marketing situation analysis report in 2015[J]. Guangdong Tea Industry,2015,3:23−28. doi: 10.3969/j.issn.1672-7398.2015.03.008
[3] 张雪娇. 福鼎白茶区域品牌可持续发展研究[D]. 福州:福建农林大学, 2020 ZHANG X J. Study on regional brand sustainable development of Fuding white tea[D]. Fuzhou:Fujian Agriculture and Forestry University, 2020.
[4] GAO L, BIAN M X, MI R F, et al. Quality identification and evaluation of Pu-erh teas of different grade levels and various ages through sensory evaluation and instrumental analysis[J]. International Journal of Food Science and Technology,2016,51(6):1338−1348. doi: 10.1111/ijfs.13103
[5] 范培珍, 郑雨婷, 王梦馨, 等. 不同等级霍山黄芽茶滋味的电子舌评价及呈味氨基酸组成[J]. 贵州农业科学,2017,45(5):105−109 doi: 10.3969/j.issn.1001-3601.2017.05.026 FANG P Z, ZHENG Y T, WANG M X, et al. Taste and delicious amino acid composition of Huoshanhuangya tea with different grades determined by an electronic tongue[J]. Guizhou Agricultural Sciences,2017,45(5):105−109. doi: 10.3969/j.issn.1001-3601.2017.05.026
[6] 贺玮, 胡小松, 赵镭, 等. 电子舌技术在普洱散茶等级评价中的应用[J]. 食品工业科技,2009,30(11):125−127, 131 HE W, HU X S, ZHAO L, et al. Application of electronic tongue in the Pu-er tea quality grade analysis[J]. Science and Technology of Food Industry,2009,30(11):125−127, 131.
[7] QIN Z H, PANG X L, CHEN D, et al. Evaluation of Chinese tea by the electronic nose and gas chromatography-mass spectrometry:Correlation with sensory properties and classification according to grade level[J]. Food Research International,2013,53(2):864−874. doi: 10.1016/j.foodres.2013.02.005
[8] 虞培力, 赵粼, 王晞丞, 等. 人工智能对龙井茶等级识别研究[J]. 现代农业科技,2018,712(2):260−263 doi: 10.3969/j.issn.1007-5739.2018.02.144 YU P L, ZHAO L, WANG X C, et al. Study on Longjing tea classification by artificial intelligence[J]. Modern Agricultural Science and Technology,2018,712(2):260−263. doi: 10.3969/j.issn.1007-5739.2018.02.144
[9] 刘洋, 余天星, 李明玺, 等. 基于近红外光谱技术的信阳毛尖品质判别研究[J]. 现代食品科技,2018,34(8):225−230, 251 doi: 10.13982/j.mfst.1673-9078.2018.8.033 LIU Y, YU T X, LI M X, et al. Quality discriminant of Xinyang Maojian tea based on near infrared spectroscopy[J]. Modern Food Science and Technology,2018,34(8):225−230, 251. doi: 10.13982/j.mfst.1673-9078.2018.8.033
[10] 彭清维, 刘芸, 于建成, 等. 基于可见/近红外光谱技术的湄潭翠芽等级判别[J]. 茶叶科学,2017,37(5):458−464 doi: 10.3969/j.issn.1000-369X.2017.05.004 PENG Q W, LIU Y, YU J C, et al. Identification of Meitan Cuiya tea grades based on visible-near-infrared technology[J]. Journal of Tea Science,2017,37(5):458−464. doi: 10.3969/j.issn.1000-369X.2017.05.004
[11] 蒋帆, 乔欣, 郑华军, 等. 基于高光谱分析技术的机炒龙井茶等级识别方法[J]. 农业工程学报,2011,27(7):343−348 doi: 10.3969/j.issn.1002-6819.2011.07.060 JIANG F, QIAO X, ZHENG H J, et al. Grade discrimination of machine-fried Longjing tea based on hyperspectral technology[J]. Transactions of the Chinese Society of Agricultural Engineering,2011,27(7):343−348. doi: 10.3969/j.issn.1002-6819.2011.07.060
[12] SUHANDY D, YULIA M. Potential application of UV-visible spectroscopy and PLS-DA method to discriminate Indonesian CTC black tea according to grade levels[J]. IOP Conference Series Earth and Environmental Science,2019,258:12042. doi: 10.1088/1755-1315/258/1/012042
[13] 龙立梅, 宋沙沙, 曹学丽. 基于香气成分气相色谱-质谱指纹图谱的判别分析和相似度评价用于绿茶等级差异研究[J]. 色谱,2019,37(3):325−330 doi: 10.3724/SP.J.1123.2018.10017 LONG L M, SONG S S, CAO X L. Discriminant analysis and similarity evaluation of gas chromatography-mass spectrometry fingerprints of aroma components in green tea grading[J]. Chinese Journal of Chromatography,2019,37(3):325−330. doi: 10.3724/SP.J.1123.2018.10017
[14] 刘臣, 唐长波, 张雷, 等. 苏州洞庭碧螺春茶指纹图谱及不同等级茶叶品质比较[J]. 江苏农业科学,2012,40(12):330−333 doi: 10.3969/j.issn.1002-1302.2012.12.133 LIU C, TANG C B, ZHAO L, et al. Fingerprint of Suzhou Dongting Biluochun tea and quality comparison of different grades of tea[J]. Jiangsu Agricultural Sciences,2012,40(12):330−333. doi: 10.3969/j.issn.1002-1302.2012.12.133
[15] 潘天红, 李鱼强, 陈琦, 等. 基于Elastic Net特征变量选择的黄山毛峰茶等级评价[J]. 农业工程学报,2020,36(13):264−271 doi: 10.11975/j.issn.1002-6819.2020.13.031 PAN T H, LI Y Q, CHEN Q, et al. Evaluation of Huangshan Maofeng tea grades based on feature variable selection using Elastic Net[J]. Transactions of the Chinese Society of Agricultural Engineering,2020,36(13):264−271. doi: 10.11975/j.issn.1002-6819.2020.13.031
[16] ZHU J, ZHU F Y, LI L Q, et al. Highly discriminant rate of Dianhong black tea grades based on fluorescent probes combined with chemometric methods[J]. Food Chemistry,2019,298(15):125046.
[17] 张程, 王进, 鲁晓卉, 等. 基于图像颜色和纹理特征的成品茶种类与等级识别[J]. 中国茶叶加工,2020,160(2):5−11 doi: 10.15905/j.cnki.33-1157/ts.2020.02.001 ZHANG C, WANG J, LU X H, et al. Recognition of types and grades of tea products based on image color and texture features[J]. China Tea Processing,2020,160(2):5−11. doi: 10.15905/j.cnki.33-1157/ts.2020.02.001
[18] 任广鑫, 金珊珊, 李露青, 等. 近红外光谱技术在茶叶品控与装备创制领域的研究进展[J]. 茶叶科学,2020,40(6):707−714 doi: 10.3969/j.issn.1000-369X.2020.06.012 REN G X, JIN S S, LI L Q, et al. Research progress of near-infrared spectroscopy in tea quality control and equipment development[J]. Journal of Tea Science,2020,40(6):701−714. doi: 10.3969/j.issn.1000-369X.2020.06.012
[19] 王胜鹏, 高士伟, 滕靖, 等. 近红外光谱技术在茶叶中的研究进展[J]. 华中农业大学学报,2021,40(5):226−232 doi: 10.13300/j.cnki.hnlkxb.2021.05.027 WANG S P, GAO S W, TENG J, et al. Progress of using near infrared spectroscopy in tea[J]. Journal of Huazhong Agricultural University,2021,40(5):226−232. doi: 10.13300/j.cnki.hnlkxb.2021.05.027
[20] 周健, 成浩, 曾建明, 等. 基于近红外的多相偏最小二乘模型组合分析实现茶叶原料品种鉴定与溯源的研究[J]. 光谱学与光谱分析,2010,30(10):2650−2653 doi: 10.3964/j.issn.1000-0593(2010)10-2650-04 ZHOU J, CHEN H, ZENG J M, et al. Study on identification and traceability of tea material cultivar by combined analysis of multi-partial least squares models based on near infrared spectroscopy[J]. Spectroscopy and Spectral Analysis,2010,30(10):2650−2653. doi: 10.3964/j.issn.1000-0593(2010)10-2650-04
[21] 杨梦璇. 基于近红外光谱技术的白茶品质快速评价方法的研究[D]. 杭州:浙江大学, 2017 YANG M X. Study on rapid evaluation method of white tea quality based on near infrared spectroscopy[D]. Hangzhou:Zhejiang University, 2017.
[22] 张瑞廷, 程江辉, 徐佳. 气相离子迁移谱在食品风味研究中的应用[J]. 现代食品,2020,10:167−169 doi: 10.16736/j.cnki.cn41-1434/ts.2020.10.057 ZHANG R T, CHENG J H, XU J, et al. Application of gas chromatography ionmobility spectrometry in the study of food flavor[J]. Modern Food,2020,10:167−169. doi: 10.16736/j.cnki.cn41-1434/ts.2020.10.057
[23] 刘亚芹, 王辉, 黄建琴, 等. GC-IMS在绿茶挥发性物质定性分析中的应用[J]. 中国茶叶加工,2020,159(1):55−59 doi: 10.15905/j.cnki.33-1157/ts.2020.01.014 LIU Y Q, WANG H, HUAGN J Q, et al. Application of GC-IMS in qualitative analysis of volatile compounds in green tea[J]. China Tea Processing,2020,159(1):55−59. doi: 10.15905/j.cnki.33-1157/ts.2020.01.014
[24] 林若川, 邓榕, 许丽蓉. 基于GC-IMS技术的绿茶风味鉴别方法可行性的研究[J]. 广东化工,2017,44(23):19−21 doi: 10.3969/j.issn.1007-1865.2017.23.012 LIN R C, DENG R, XU L R. Feasibility study of green tea flavor identification based on GC-IMS technology[J]. Guangdong Chemical Industry,2017,44(23):19−21. doi: 10.3969/j.issn.1007-1865.2017.23.012
[25] 祁兴普, 刘纯友, 佀再勇, 等. 基于风味指纹谱的庐山云雾茶品质等级研究[J]. 食品研究与开发,2021,42(14):152−157 doi: 10.12161/j.issn.1005-6521.2021.14.024 QI X P, LIU C Y, SI Z Y, et al. Study on quality grading of Lushan cloud-fog tea based on flavor fingerprints[J]. Science and Technology of Food Industry,2021,42(14):152−157. doi: 10.12161/j.issn.1005-6521.2021.14.024
[26] 郭向阳, 霍羽佳, 王本友, 等. 采用气相色谱-离子迁移谱分析黄大茶加工过程挥发性成分[J]. 农业工程学报,2021,37(6):274−281 GUO X Y, HUO Y J, WANG B Y, et al. Analysis of volatile compounds in large-leaf yellow tea during manufacturing processes using gas chromatography-ion mobility spectrometry[J]. Transactions of the Chinese Society of Agricultural Engineering,2021,37(6):274−281.
[27] 王志华, 薛志慧, 朱文伟, 等. 基于GC-IMS的不同年份紧压白茶挥发性物质分析[J]. 食品与生物技术学报,2021,40(8):85−94 doi: 10.3969/j.issn.1673-1689.2021.08.011 WANG Z H, XUE Z H, ZHU W W, et al. Analyses of volatile compounds in compressed white tea of different years based on GC-IMS [J]. Journal of Food Science and Biotechnology,2021,40(8):85−94. doi: 10.3969/j.issn.1673-1689.2021.08.011
[28] 沈诗钰, 孙威江, 唐琴, 等. 基于近红外光谱技术的白茶可溶性糖总量快速测定研究[J]. 天然产物研究与开发,2019,31(1):16−23 doi: 10.16333/j.1001-6880.2019.1.003 SHEN S Y, SUN W J, TANG Q, et al. Rapid determination of total water-soluble sugars in white tea by near-infrared spectroscopy[J]. Natural Product Research and Development,2019,31(1):16−23. doi: 10.16333/j.1001-6880.2019.1.003
[29] 罗玉琴, 韦燕菊, 林琳, 等. 基于GC-IMS技术的福建白茶产地判别[J]. 农业工程学报,2021,37(6):264−273 doi: 10.11975/j.issn.1002-6819.2021.06.032 LUO Y Q, WEI Y J, LIN L, et al. Origin discrimination of Fujian white tea using gas chromatography-ion mobility spectrometry[J]. Transactions of the Chinese Society of Agricultural Engineering,2021,37(6):264−273. doi: 10.11975/j.issn.1002-6819.2021.06.032
[30] 祝海江, 唐昊, 孙静娴, 等. 基于时频谱特征的白酒品质分类方法研究[J]. 光谱学与光谱分析, 2021, 41(9):2962−2968 ZHU H J, TANG H, SUN J X, et al. Classification method of liquor quality based on time and frequency spectrum characteristics[J]. Spectroscopy and Spectral Analysis, 2021, 41(9):2962−2968.
[31] YANG J, WANG J, LU G, et al. TeaNet:deep learning on near-infrared spectroscopy (NIR) data for the assurance of tea quality[J]. Computer and Electronics in Agriculture,2021,190, 106431. doi: 10.1016/j.compag.2021.106431
[32] ZHANG L, DAI H, ZHANG J, et al. A study on origin traceability of white tea (white peony) based on near-infrared spectroscopy and machine learning algorithms[J]. Foods,2023,12, 499. doi: 10.3390/foods12030499
[33] ZONG X, SHENG X, LI L, et al. Rapid detection of moisture content in the processing Longjing tea by micro-near-infrared spectroscopy and a portable colorimeter based on a data fusion strategy[J]. Horticulturae,2022,8(11):1007. doi: 10.3390/horticulturae8111007
[34] DANKOWSKA A, KOWALEWSKI W. Tea type classification with data fusion of UV-Vis, synchronous fluorescence and NIR spectroscopies and chemometric analysis[J]. Spectrochimica Acta Part A-Molecular and Biomolecular Spectroscopy,2019,211:195−202. doi: 10.1016/j.saa.2018.11.063
[35] JIN G, ZHU Y, CUI C, et al. Tracing the origin of Taiping Houkui green tea using 1H NMR and HS-SPME-GC-MS chemical fingerprints, data fusion and chemometrics[J]. Food Chemistry,2023,425:136538. doi: 10.1016/j.foodchem.2023.136538
-
期刊类型引用(4)
1. 甘芳瑗,刘振平,傅丙生,龙道崎,庞钶靖,姜容. 气相色谱-离子迁移谱技术在茶叶领域应用的研究进展. 茶叶科学. 2024(04): 565-574 .  百度学术
百度学术
2. 陈瀑,杨健,褚小立,李敬岩,许育鹏,刘丹. 近五年我国近红外光谱分析技术的研究与应用进展. 分析化学. 2024(09): 1213-1224 . 百度学术
3. 杨高中,赵燕,朱荫,张悦,彭群华,施江,吕海鹏,林智. 2023年茶叶加工品质调控研究进展. 中国茶叶. 2024(11): 7-22+56 . 百度学术
4. 陈丽琴,周子维,蔡亚威,张朝辉,江胜滔,艾克拜尔·热合曼,陈艳. 基于UPLC-MS/MS技术的9个白茶实物标准样主要化学成分分析. 中国农业科技导报. 2024(12): 50-62 . 百度学术
其他类型引用(1)
 下载:
下载:


计量
- 文章访问数: 95
- HTML全文浏览量: 32
- PDF下载量: 20
- 被引次数: 5