Origin Characteristics and Traceability Discrimination of Jiangxi Tea based on Rare Earth Element Contents
-
摘要: 为了解江西茶叶中稀土元素的残留状况,减少稀土污染,提高茶叶品质。研究建立江西茶叶产地判别技术,为保护地理标志产品、追溯原产地来源提供理论依据。本研究采集江西省遂川县、庐山县和婺源县共3个产地的138批次茶叶样品,利用电感耦合等离子串联质谱仪法(ICP-MS/MS)测定茶叶中15种稀土元素含量,并对数据进行主成分分析和判别分析,建立产地判别模型。结果表明,3个产地138批次茶叶的稀土氧化物总量在0.44~1.57 mg·kg−1之间,均未超出国家标准GB 2762-2012限量。经过主成分分析,从15种稀土元素可提取3个主成分,代表了总指标90.66%的信息;利用判别典型函数分析,回代检验100%正确判别,交叉检验的正确判别率为99.3%。此方法证明稀土元素技术可用于江西茶叶的产地溯源,为今后江西各种知名茶叶品牌的原产地保护提供鉴定基础。Abstract: To investigate the rare earth elements residues in teas from Jiangxi Province in order to provide suggestions on reducing rare earth elements (REEs) contamination, and to improve the quality of tea. A method for geographical origin discrimination of tea from Jiangxi Province was established to provide technical support for the protection of geographical indication products and for tracing the geographic origin of agricultural products. One hundred and thirty-eight samples of tea were collected from three producing areas: The counties of Suichuan, Lushan and Wuyuan in this study. Inductively coupled plasma tandem mass spectrometry (ICP-MS/MS) was used to determine the contents of 15 rare earth elements in tea. Principal component analysis (PCA) and fisher linear discriminant analysis (FLD) were applied to differentiate the tea geographical origin. The results showed that the total amount of rare earth oxides in the teas were 0.44~1.57 mg·kg−1 and did not exceed the national limit standard of rare earth elements in tea (GB 2762-2012). After principal component analysis, three principal components were extracted from 15 rare earth elements (REEs), representing 90.66% of the total index information. Fisher discriminant analysis showed that the correct discriminant rates of back generation test and cross test were 100% and 99.3%. It is proved that rare earth elements (REEs) tracing technology can be used in tea origin discrimination and provide the identification basis for the protection of the origin of Jiangxi famous tea brands in the future.
-
作为稀土大省,江西茶叶中的稀土含量,引起人们的广泛关注。茶叶在江西种植历史悠久,形成了遂川狗牯脑茶、婺源绿茶、庐山云雾茶、浮梁茶、宁红茶等“四绿一红”5个重点品牌。到2022年,全省茶园面积稳定在180万亩左右,茶叶总产量到15万吨以上,总产值突破150亿元[1]。适量的稀土含量能对作物具有增加产量、增强抗逆性和抗病性的作用[2−3],在临床上具有消炎杀菌、抗肿瘤、抗动脉硬化等药效[4−6]。但过量的稀土积蓄,会引起大脑损伤,诱发骨质疏松[7−8],引起血液成分变化等多种中毒现象[9−10]。因此,国家标准(GB 2762-2005)《食品中污染物限量》对各类食品中稀土含量做了严格的规定,其中茶叶中稀土氧化物的含量≤2.0 mg·kg−1。对江西茶叶中的稀土含量进行调查研究,摸清茶叶中稀土含量是否超标,以消除人们对江西茶叶稀土超标的担忧有着重要意义。
茶叶中的稀土元素主要来源于茶园土壤、肥料和大气沉降等,且叶片生长周期越长,积累的稀土也越多[9]。茶叶因种类和产区等的不同,稀土元素含量及种类也会不尽相同,因此常被广泛运用在六堡茶[11]、大米[12]、茶叶[13−15]、扁形茶[16]、大桃[17]、紫菜[18]、绿茶[19−20]等产品的产地溯源中。江西茶叶历来备受人们青睐,在茶叶市场上,常常出现以普通茶叶假冒名牌茶叶的情况,特别是以非原产地茶叶假冒原产地茶叶的情况,严重影响了江西名牌茶叶的信誉,因此需要研发产地溯源与鉴别的方法以保护江西茶叶产地品牌。通过对原产地产品中多种元素含量进行测定,形成特异指纹图谱,并运用主成分分析(PCA)、线性判别分析(LDA)等方法对不同产地的产品进行判别分析,对地龙[21]、葡萄酒[22−23]、樱桃[24]、半夏[25]、大米[26]、咖啡[27]、桃[28]、人参[29]、金枪鱼[30]、苹果[31]等产品都能较好的进行产地溯源。而对江西茶叶中稀土元素含量特征调查并运用稀土元素特异性指纹图谱进行产地溯源研究较少。
本研究采用微波消解-电感耦合等离子体串联质谱(ICP-MS/MS)法测定了采自遂川、庐山、婺源县茶叶中的15种稀土元素,并采用SPSS统计软件进行主成分分析法和判别分析法建立产地溯源模型,以期为江西茶叶的质量安全控制和产地判别提供科学依据。
1. 材料与方法
1.1 材料与仪器
实验样品 采集江西赣东北代表婺源县,赣西北代表庐山县,赣中南代表遂川县三大优势产区的茶叶样品138份样品,其中婺源县(46个),庐山县(50个)遂川县(42个);验证样品 3份采集遂川县茶叶和3份市场购买的安吉白茶;稀土元素混合溶液标准物质(BWB 2462-2016)100 µg·mL−1 北京北方伟业计量技术研究院;调谐溶液:ICP-MS/MS储备调谐溶液(Ce、Co、Li、Mg、Tl、Y)10 mg/L、ICP-MS/MS储备混合内标溶液(Bi、Ge、In、Li、Lu、Rh、Sc、Tb)10 mg·L−1 美国安捷伦有限公司;硝酸、双氧水 优级纯,上海国药化学试剂有限公司。
Agilent 8800三重串联电感耦合等离子体质谱仪(ICP-MS/MS)配置x型透镜系统 美国安捷伦有限公司;Milli-Q超纯水系统 美国Milli公司;CEM(Mars 6 Classic)微波消解仪 美国CEM公司。
1.2 实验方法
1.2.1 样品前处理
将实验样品与验证样品于60 ℃烘箱中烘4 h,碾碎,装入密封袋备用。准确称取0.50 g(精确到0.1 mg)茶叶样品于聚四氟乙烯消解罐中,每隔5个样品称取一份平行样品,每隔10个样品做一个加标回收样品,加入5 mL酸和1 mL双氧水,盖上盖子浸泡过夜,第2 d在微波消解仪中100 ℃保持5 min,150 ℃保持5 min,180 ℃保持30 min进行消解,消解完后在150 ℃消解炉上赶酸至约1 mL,用水将样品转移定容到25 mL容量瓶中,待测。
1.2.2 仪器参数
通过前期预实验优化,获得了以下参数(表1),用于测定,并根据反应池选择的反应气体,相应的选择同一质量数模式(SQ)或者是双质量数模式(MS/MS)。
表 1 ICP-MS/MS参数Table 1. Parameters of ICP-MS/MS for each gas mode参数 He O2 mass shift H2 on mass NH3 mass shift 测量模式 SQ MS/MS MS/MS MS/MS RF功率 − 1550 1550 − 采样深度 − 8 8 − 载气 − 0.7 0.7 − 进样方式 自动进样,溶液提升速率:0.4 r/s;溶液提升时间:30 s,
溶液稳定速率:0.1 r/s,溶液稳定时间:40 s,内标元素
In、Rh、Sc通过T型三通管在线引入,雾化器:
MicroMist;雾化室温度:2 ℃MS/MS 扫描方式:跳峰,测量点/峰:3点,
扫描质量数:28Si、56Fe、169TmH2(mL/min) − − 2 − O2(mL/min) − 2 − − 1.2.3 REE含量测量
用1%稀硝酸将稀土混合标准准备液(100 µg.mL−1,含15种稀土元素La、Ce、Pr、Nd、Sm、Eu、Gd、Tb、Dy、Ho、Er、Tm、Yb、Lu、Y)逐级稀释为1.0、2.0、4.0、8.0、16.0 µg/L,按照表1设定电感耦合等离子体串联质谱仪(ICP-MS/MS)的仪器参数,在He碰撞模式下测定La、Ce、Pr、Nd、Sm、Dy、Ho、Er、Tm、Yb、Lu、Y;在加氧模式下测定Eu、Gd、Tb,通过采集空白溶液(1% HNO3)和标准溶液系列,内标通过内标管在线引入质谱仪,由仪器自动绘制标准曲线。
1.3 数据处理
运用SPSS 26.0软件对原始数据进行标准化。将原始数据减去该变量的平均数,然后除以该变量的标准差。以消除原始数据间的量纲影响,使数据更具可比性。并且采用SPSS 26.0软件对3个县的茶叶中的稀土元素进行主成分分析,并在主成分分析的基础上建立判别模型。
2. 结果与分析
2.1 样品稀土元素的测定结果分析
通过实验得到15种稀土元素测定标准曲线,相关系数都大于0.999;通过加标回收验证,得到样品加标回收率为98.85%~104.18%,相对标准偏差(RSD)为0.12%~2.65%,说明此实验方法完全满足实验要求。138个茶叶样品的测定结果如表1所示,结果表明,3个产地的茶叶稀土氧化物的总量在0.44~1.57 mg·kg−1,均未超出国家标准GB 2762-2012。遂川县茶叶样品总稀土含量为3县最高,达1.31 mg·kg−1,其中以La、Y、Dy为主,占92.05%,轻稀土元素(LREE)与重稀土元素(HREE)各占一半;庐山县茶叶样品中稀土以重稀土元素(HREE)为主,占95.58%,包括Y 66.02%、Tm 12.68%、Dy 6.48%、Er 6.38%;婺源县茶叶样品中稀土以重稀土元素(HREE)为主,占95.27%,包括Y 62.13%、Tm 11.53%、Dy 8.44%、Er 6.31%,其中轻稀土元素(LREE)Eu占总稀土含量的6.63%为3县最高。
2.2 主成分分析
以表2中15种稀土元素原始数据为自变量,将不同产地的茶叶的检测结果进行主成分分析。
表 2 3个县的茶叶样品中15种稀土元素含量和组成比例Table 2. Content and composition pf 15 rare earth elements in tea samples from three counties元素 遂川(SC) 庐山(LS) 婺源(WY) 含量(µg·kg−1) 比例(%) 含量(µg·kg−1) 比例(%) 含量(µg·kg−1) 比例(%) La 652.23±37.58 51.30 1.01±0.25 0.24 0.63±0.08 0.16 Ce 2.59±0.49 0.20 0.96±0.18 0.23 1.47±0.28 0.38 Pr 0.31±0.07 0.02 0.15±0.04 0.04 0.09±0.02 0.02 Nd 1.17±0.19 0.09 0.56±0.08 0.13 0.36±0.06 0.09 Sm 0.18±0.06 0.01 0.13±0.04 0.03 0.09±0.03 0.02 Eu 0.06±0.02 0.00 15.57±2.13 3.65 25.69±2.26 6.63 ∑LREE 656.55±37.82 51.64 18.4±2.19 4.32 18.34±2.22 4.73 Gd 0.50±0.09 0.04 0.14±0.03 0.03 0.06±0.02 0.02 Tb 0.15±0.08 0.01 0.02±0.01 0.00 0.02±0.01 0.01 Dy 55.45±4.46 4.36 27.4±3.46 6.43 32.7±3.98 8.44 Ho 11.5±1.19 0.90 3.76±0.72 0.88 4.55±0.46 1.17 Er 34.16±2.67 2.69 27.19±4.84 6.38 24.44±2.79 6.31 Tm 4.80±0.89 0.38 54.02±7.45 12.68 44.67±4.02 11.53 Yb 32.96±4.3 2.59 6.53±0.77 1.53 13.37±1.73 3.45 Lu 12.75±1.39 1.00 7.81±0.63 1.83 8.61±0.29 2.22 Y 462.66±37.39 36.39 281.23±21.91 66.02 240.81±20.02 62.13 ∑HREE 614.94±39.00 48.36 408.11±27.24 95.58 369.24±21.25 95.27 ∑REE 1271.59±38.55 100 426.51±26.15 100 387.58±20.65 100 (1525.91±46.26) (511.81±31.38) (465.10±24.78) ∑LREE/∑HREE 1.07 − 0.045 − 0.050 − 注:表中数据为平均数±标准误差;∑LREE表示轻稀土总和;∑HREE表示重稀土总和;∑REE表示稀土总含量;括号内的数据为稀土氧化物总量。 2.2.1 适应性检验
确定数据是否适合进行主成分分析的常用检验方法是巴特利特(Bartlett)球形度检验和(kaiser-Meyer-Olkin)KMO取样适合度检验,用来判断原始变量之间的相关性,即只有原始变量之间有重叠的信息,才能提取这几个变量之间的公因子进行主成分分析。
由表3可知,KMO取样适切性量数结果为0.956>0.5,可以看出不同产地的茶叶中各指标之间的信息重叠程度较高,能够进行主成分分析,巴特利特球形度检验的显著性为0.000<0.05,球形假设被拒绝,也说明各变量之间的存在相关性可以进行主成分分析。
表 3 KMO和巴特利特检验结果Table 3. Results of KMO and Bartlett tests项目 结果 KMO取样适切性量数 0.956 巴特利特球形度检验 近似卡方 3760.968 自由度 105 显著性 0.000 2.2.2 主成分方差贡献率
本研究以138个茶叶中15种稀土元素含量构建138×15的矩阵,原来的15个指标变量,通过正交变化产生了15个新变量,每个新变量可以解释的原始变量的总方差比例不同,但是所有解释的比例之和为100%。
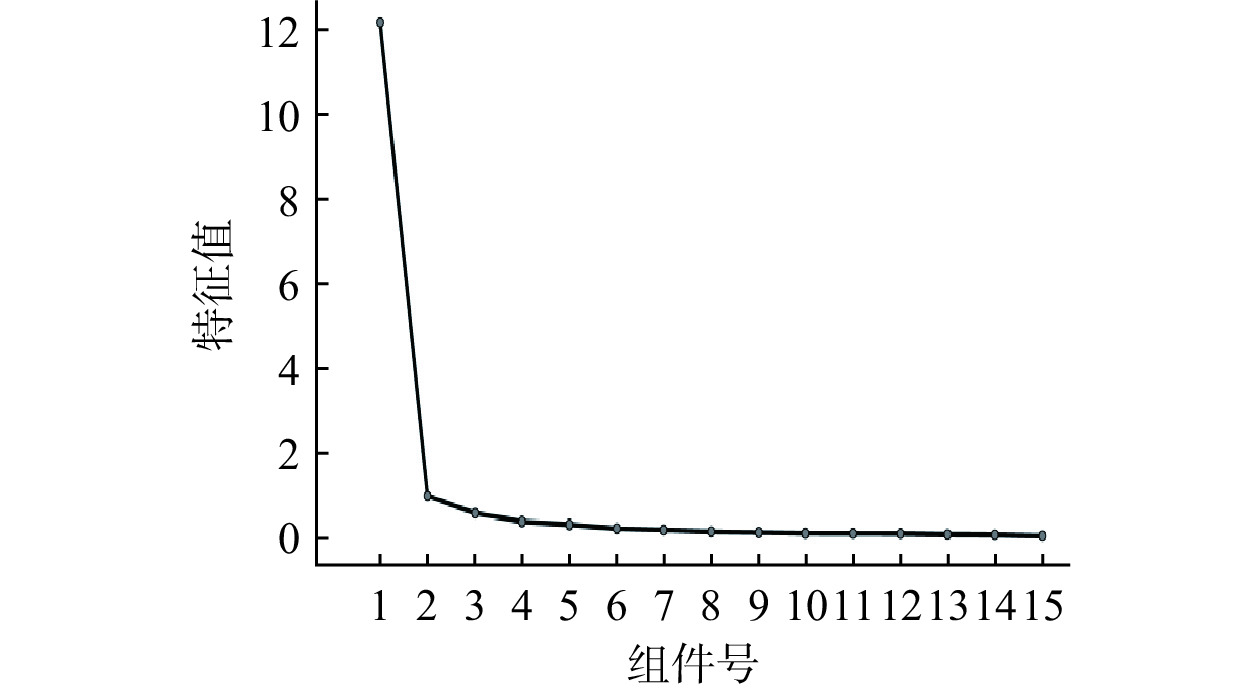
利用SPSS软件进行主成分分析,以提取特征值>0.5,得到结果如表4所示,提取了3个主成分,解释90.662%的总方差,它们代表了大部分指标在不同产地的茶叶中的原始信息。
表 4 主成分方差贡献率Table 4. Variance contribution rate of principal components成分 初始特征值 提取载荷平方和 总计 方差(%) 累积(%) 总计 方差(%) 累积(%) 1 12.123 80.822 80.822 12.123 80.822 80.822 2 0.942 6.279 87.102 0.942 6.279 87.102 3 0.534 3.560 90.662 0.534 3.560 90.662 前面陡峭的部分特征值大,包含的信息多,后面平坦的部分特征值小,包含的信息小。由图1碎石图也可以直观的看出,成分1、2和3包含了大部分信息,从4开始进入平台。
![]() 图 1 3个县茶叶主成分碎石图Figure 1. Scree plot of tea principal component analysis in three counties
图 1 3个县茶叶主成分碎石图Figure 1. Scree plot of tea principal component analysis in three counties2.2.3 各个指标在每个主成分中的得分系数
利用SPSS软件进行主成分分析,以提取特征值>0.5,可以得到3个主成分,15种稀土在3个主成分中的得分系数也不同,可以从表5中明显得出,第一个主成分主要是由La、Ce、Pr、Nd、Sm、Gd、Tb、Dy、Ho、Er、Yb、Lu、Y原始指标变量组成,第二个主成分主要是由Pr、Nd、Sm、Tm原始指标变量组成,第三个主成分主要是由Er原始指标变量组成。
表 5 主成分与原始指标变量的相关系数Table 5. Correlation coefficients between principal components and original index variables指标 成分 1 2 3 La(X1) 0.992 −0.051 0.006 Ce(X2) 0.867 −0.278 −0.124 Pr(X3) 0.882 0.339 0.001 Nd(X4) 0.932 0.269 −0.024 Sm(X5) 0.629 0.659 −0.292 Eu(X6) −0.964 0.058 −0.002 Gd(X7) 0.945 0.098 0.052 Tb(X8) 0.829 −0.055 −0.126 Dy(X9) 0.93 −0.204 −0.038 Ho(X10) 0.967 −0.094 −0.017 Er(X11) 0.725 0.172 0.633 Tm(X12) −0.943 0.216 0.047 Yb(X13) 0.934 −0.255 −0.039 Lu(X14) 0.92 −0.16 −0.048 Y(X15) 0.95 0.086 0.081 将茶叶样品的15个原始指标分别记作X1~X15,3个主成分分别记作F1~F3。根据表5各个指标在每个主成分中的得分系数,得到3个主成分的数学模型分别为:
F1=0.082X1+0.072X2+0.073X3+0.077X4+0.052X5−0.08X6+0.078X7+0.068X8+0.077X9+0.08X10+0.06X11−0.078X12+0.077X13+0.076X14+0.078X15;
F2=−0.055X1−0.295X2+0.36X3+0.286X4+0.699X5+0.062X6+0.104X7−0.058X8−0.217X9−0.1X10+0.182X11+0.229X12−0.271X13−0.17X14+0.091X15;
F3=0.012X1−0.232X2+0.002X3−0.046X4−0.546X5−0.003X6+0.097X7−0.236X8−0.071X9−0.031X10+1.185X11+0.087X12−0.073X13−0.089X14+0.151X15。
将原始指标标准化后的结果带入上述数学模型,可以得到每个样品的3个主成分结果,结果见表6。
表 6 各指标在每个主成分中的得分系数Table 6. Score coefficients of each index in each principal component指标 成分 F1 F2 F3 La(X1) 0.082 −0.055 0.012 Ce(X2) 0.072 −0.295 −0.232 Pr(X3) 0.073 0.36 0.002 Nd(X4) 0.077 0.286 −0.046 Sm(X5) 0.052 0.699 −0.546 Eu(X6) −0.08 0.062 −0.003 Gd(X7) 0.078 0.104 0.097 Tb(X8) 0.068 −0.058 −0.236 Dy(X9) 0.077 −0.217 −0.071 Ho(X10) 0.08 −0.1 −0.031 Er(X11) 0.06 0.182 1.185 Tm(X12) −0.078 0.229 0.087 Yb(X13) 0.077 −0.271 −0.073 Lu(X14) 0.076 −0.17 −0.089 Y(X15) 0.078 0.091 0.151 2.2.4 主成分相关性分析
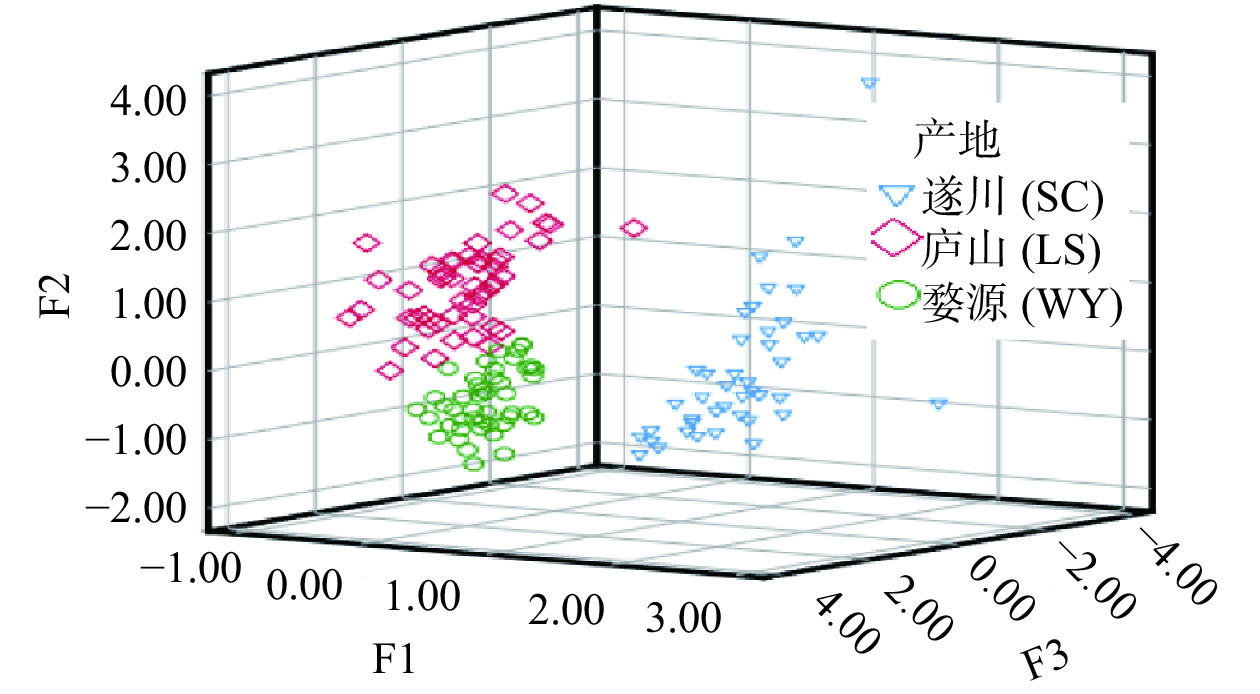
3个主成分方差贡献率为90.662%,以F1、F2、F3为X、Y、Z坐标,建立每个样品的三维图,结果见图2。
由图2可知,同一产地的茶叶样品存在很好的聚合性,不同产地的茶叶样品之间能够完全分开;同时看出,遂川茶叶主成分F3离其他两个产地较远,说明Er成为区别遂川茶叶和其他两个产地的主要原始指标;庐山、婺源两个产地的主成分F2相差较远,说明第Pr、Nd、Sm、Tm成为区别两地主要原始指标。
2.3 判别分析
2.3.1 共线性诊断
为了确定能否利用主成分F1、F2、F3为原始变量,进行判别分析,首先需要对对数据进行共线性诊断,结果如表7,共线性统计VIF值1.00<5.00,说明可以进行判别分析。
表 7 共线性诊断结果Table 7. Result of collinearity diagnostics模型 未标准化系数 标准化系数 共线性统计 B 标准错误 Beta T 显著性 容差 VIF 1 (常量) 2.029 0.027 74.739 0.000 F1 −0.679 0.027 −0.849 −24.964 0.000 1.000 1.000 F2 −0.26 0.027 −0.324 −9.527 0.000 1.000 1.000 F3 −0.113 0.027 −0.142 −4.161 0.000 1.000 1.000 注:因变量:产地。 2.3.2 典型判别函数
以主成分F1、F2、F3为原始变量,用SPSS 26.0进行判别分析,得到2个典型判别函数,结果见表8。
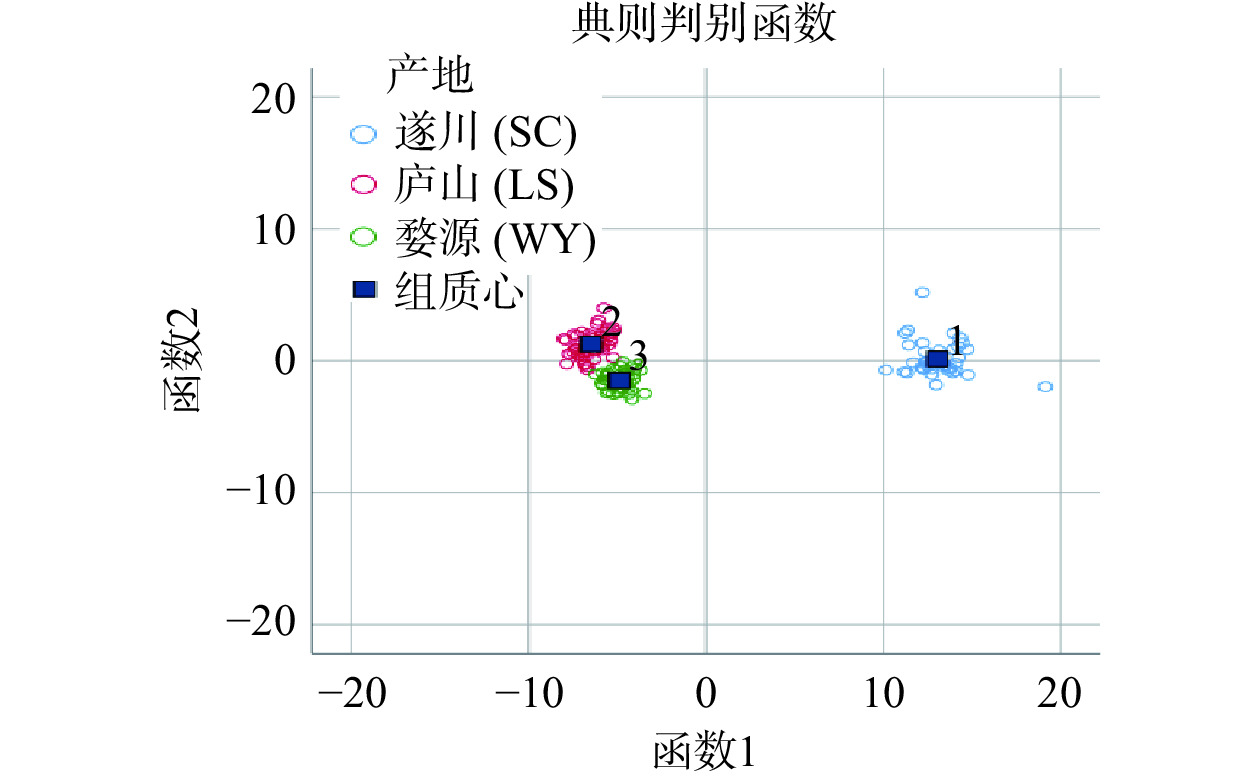
表 8 典型判别函数系数Table 8. Function coefficients of typical discriminant主成分 函数系数 1 2 F1 8.673 0.171 F2 −1.026 1.433 F3 0.014 0.480 (常量) 0.000 0.000 注:1~2代表2种不同判别函数,未标准化系数。 根据2个判别函数和组质心所在坐标函数,计算每个茶叶样品的坐标与质心的距离,与哪个产地的质心最近,见表9和图3,可知庐山样本集中在散点图的左上方,婺源样本集中在散点图的右上方,而庐山样本集中在其他两地中下方;从图中可以明显看出三地样本被很好的分离。
表 9 组质心处的函数系数Table 9. Function coefficients of the centroid产地 函数系数 1 2 遂川(SC) 13.058 0.134 庐山(LS) −6.481 1.257 婺源(WY) −4.877 −1.488 注:1~2代表2种不同判别函数。 利用函数1和函数2对组质心和样品做散点图,结果见图3。
2.3.3 判别分类结果
利用判别函数对138个样品进行判别分类,并进行回代检验和交叉验证。结果见表10,回代检验正确判别率为100%,交叉检验判别率为99.3%,除庐山样本的交叉验证为98%,其他产地的回代检验和交叉验证判别率均是100%。
表 10 判别分类结果Table 10. Results of discriminant classification方法 产地 预测组成员信息 遂川
(SC)庐山
(LS)婺源
(WY)正确判
别率(%)回代检验 遂川(n=42) 42 0 0 100 庐山(n=50) 0 50 0 婺源(n=46) 0 0 46 正确判别率(%) 100 100 100 交叉验证 遂川(SC) 42 0 0 99.3 庐山(LS) 0 49 1 婺源(WY) 0 0 46 正确判别率(%) 100 98 100 2.4 判别分类结果验证
为了进一步验证能否使用上述判别函数进行产地正确溯源,本研究重新测定了3个遂川(SC)的茶叶样品和3个市场购买的安吉白茶,并将这个6个样品假定为未知地产的样品。把6个验证样品的测定结果标准化后,将结果带入主成分分析数学模型,可以得到每个样品的3个主成分结果。利用上述的判别函数模型进行样品产地溯源验证。由表11可知,利用上述模型,138个茶叶样品的产地被全部100%正确溯源;表格的未分组个案的6个未知样品前3个被判定为来自产地遂川(SC),后3个被判定为未分组,判别结果正确。
表 11 判别分类验证结果Table 11. Results of discriminant classification test方法 产地 预测组成员信息 遂川
(SC)庐山
(LS)婺源
(WY)未分组
个案正确判
别率(%)回代
检验遂川(n=42) 42 0 0 100 庐山(n=50) 0 50 0 婺源(n=46) 0 0 46 未分组个案(n=6) 3 0 0 3 正确判别率(%) 100 100 100 100 3. 结论
茶叶生长环境的气候、水质、土壤性质、微生物种群及加工方式等不同会导致不同产地茶叶中稀土元素的种类和含量差异。本实验用电感耦合等离子体串联质谱(ICP-MS/MS)测定了138个来自婺源县(46个)庐山县(50个)婺源县(42个)的茶叶中的15种稀土元素,并利用SPSS 26.0进行主成分和判别分析。实验发现3个产地茶叶中稀土氧化物的总量在0.44~1.57 mg·kg−1,均未超出国家标准GB 2762-2012的限量;茶叶中总稀土含量:遂川县>庐山县>婺源县。利用主成分分析,以提取特征值>0.5,共提取3个主成分,累计方差贡献率达到90.66%,建立2个典型判别函数,通过回代检验,完全可以实现对抽取的不同产地的茶叶进行100%正确判别,交叉验证正确率为99.3%。研究表明,不同产地的稀土元素含量可为江西茶叶的产地溯源提供一个新方法,为今后江西各种知名茶叶品牌的原产地保护提供鉴定基础。
-
![]()
图 1 3个县茶叶主成分碎石图
Figure 1. Scree plot of tea principal component analysis in three counties
表 1 ICP-MS/MS参数
Table 1 Parameters of ICP-MS/MS for each gas mode
参数 He O2 mass shift H2 on mass NH3 mass shift 测量模式 SQ MS/MS MS/MS MS/MS RF功率 − 1550 1550 − 采样深度 − 8 8 − 载气 − 0.7 0.7 − 进样方式 自动进样,溶液提升速率:0.4 r/s;溶液提升时间:30 s,
溶液稳定速率:0.1 r/s,溶液稳定时间:40 s,内标元素
In、Rh、Sc通过T型三通管在线引入,雾化器:
MicroMist;雾化室温度:2 ℃MS/MS 扫描方式:跳峰,测量点/峰:3点,
扫描质量数:28Si、56Fe、169TmH2(mL/min) − − 2 − O2(mL/min) − 2 − −  下载: 导出CSV
表 2 3个县的茶叶样品中15种稀土元素含量和组成比例
Table 2 Content and composition pf 15 rare earth elements in tea samples from three counties
元素 遂川(SC) 庐山(LS) 婺源(WY) 含量(µg·kg−1) 比例(%) 含量(µg·kg−1) 比例(%) 含量(µg·kg−1) 比例(%) La 652.23±37.58 51.30 1.01±0.25 0.24 0.63±0.08 0.16 Ce 2.59±0.49 0.20 0.96±0.18 0.23 1.47±0.28 0.38 Pr 0.31±0.07 0.02 0.15±0.04 0.04 0.09±0.02 0.02 Nd 1.17±0.19 0.09 0.56±0.08 0.13 0.36±0.06 0.09 Sm 0.18±0.06 0.01 0.13±0.04 0.03 0.09±0.03 0.02 Eu 0.06±0.02 0.00 15.57±2.13 3.65 25.69±2.26 6.63 ∑LREE 656.55±37.82 51.64 18.4±2.19 4.32 18.34±2.22 4.73 Gd 0.50±0.09 0.04 0.14±0.03 0.03 0.06±0.02 0.02 Tb 0.15±0.08 0.01 0.02±0.01 0.00 0.02±0.01 0.01 Dy 55.45±4.46 4.36 27.4±3.46 6.43 32.7±3.98 8.44 Ho 11.5±1.19 0.90 3.76±0.72 0.88 4.55±0.46 1.17 Er 34.16±2.67 2.69 27.19±4.84 6.38 24.44±2.79 6.31 Tm 4.80±0.89 0.38 54.02±7.45 12.68 44.67±4.02 11.53 Yb 32.96±4.3 2.59 6.53±0.77 1.53 13.37±1.73 3.45 Lu 12.75±1.39 1.00 7.81±0.63 1.83 8.61±0.29 2.22 Y 462.66±37.39 36.39 281.23±21.91 66.02 240.81±20.02 62.13 ∑HREE 614.94±39.00 48.36 408.11±27.24 95.58 369.24±21.25 95.27 ∑REE 1271.59±38.55 100 426.51±26.15 100 387.58±20.65 100 (1525.91±46.26) (511.81±31.38) (465.10±24.78) ∑LREE/∑HREE 1.07 − 0.045 − 0.050 − 注:表中数据为平均数±标准误差;∑LREE表示轻稀土总和;∑HREE表示重稀土总和;∑REE表示稀土总含量;括号内的数据为稀土氧化物总量。
下载: 导出CSV
表 3 KMO和巴特利特检验结果
Table 3 Results of KMO and Bartlett tests
项目 结果 KMO取样适切性量数 0.956 巴特利特球形度检验 近似卡方 3760.968 自由度 105 显著性 0.000
下载: 导出CSV
表 4 主成分方差贡献率
Table 4 Variance contribution rate of principal components
成分 初始特征值 提取载荷平方和 总计 方差(%) 累积(%) 总计 方差(%) 累积(%) 1 12.123 80.822 80.822 12.123 80.822 80.822 2 0.942 6.279 87.102 0.942 6.279 87.102 3 0.534 3.560 90.662 0.534 3.560 90.662
下载: 导出CSV
表 5 主成分与原始指标变量的相关系数
Table 5 Correlation coefficients between principal components and original index variables
指标 成分 1 2 3 La(X1) 0.992 −0.051 0.006 Ce(X2) 0.867 −0.278 −0.124 Pr(X3) 0.882 0.339 0.001 Nd(X4) 0.932 0.269 −0.024 Sm(X5) 0.629 0.659 −0.292 Eu(X6) −0.964 0.058 −0.002 Gd(X7) 0.945 0.098 0.052 Tb(X8) 0.829 −0.055 −0.126 Dy(X9) 0.93 −0.204 −0.038 Ho(X10) 0.967 −0.094 −0.017 Er(X11) 0.725 0.172 0.633 Tm(X12) −0.943 0.216 0.047 Yb(X13) 0.934 −0.255 −0.039 Lu(X14) 0.92 −0.16 −0.048 Y(X15) 0.95 0.086 0.081
下载: 导出CSV
表 6 各指标在每个主成分中的得分系数
Table 6 Score coefficients of each index in each principal component
指标 成分 F1 F2 F3 La(X1) 0.082 −0.055 0.012 Ce(X2) 0.072 −0.295 −0.232 Pr(X3) 0.073 0.36 0.002 Nd(X4) 0.077 0.286 −0.046 Sm(X5) 0.052 0.699 −0.546 Eu(X6) −0.08 0.062 −0.003 Gd(X7) 0.078 0.104 0.097 Tb(X8) 0.068 −0.058 −0.236 Dy(X9) 0.077 −0.217 −0.071 Ho(X10) 0.08 −0.1 −0.031 Er(X11) 0.06 0.182 1.185 Tm(X12) −0.078 0.229 0.087 Yb(X13) 0.077 −0.271 −0.073 Lu(X14) 0.076 −0.17 −0.089 Y(X15) 0.078 0.091 0.151
下载: 导出CSV
表 7 共线性诊断结果
Table 7 Result of collinearity diagnostics
模型 未标准化系数 标准化系数 共线性统计 B 标准错误 Beta T 显著性 容差 VIF 1 (常量) 2.029 0.027 74.739 0.000 F1 −0.679 0.027 −0.849 −24.964 0.000 1.000 1.000 F2 −0.26 0.027 −0.324 −9.527 0.000 1.000 1.000 F3 −0.113 0.027 −0.142 −4.161 0.000 1.000 1.000 注:因变量:产地。
下载: 导出CSV
表 8 典型判别函数系数
Table 8 Function coefficients of typical discriminant
主成分 函数系数 1 2 F1 8.673 0.171 F2 −1.026 1.433 F3 0.014 0.480 (常量) 0.000 0.000 注:1~2代表2种不同判别函数,未标准化系数。
下载: 导出CSV
表 9 组质心处的函数系数
Table 9 Function coefficients of the centroid
产地 函数系数 1 2 遂川(SC) 13.058 0.134 庐山(LS) −6.481 1.257 婺源(WY) −4.877 −1.488 注:1~2代表2种不同判别函数。
下载: 导出CSV
表 10 判别分类结果
Table 10 Results of discriminant classification
方法 产地 预测组成员信息 遂川
(SC)庐山
(LS)婺源
(WY)正确判
别率(%)回代检验 遂川(n=42) 42 0 0 100 庐山(n=50) 0 50 0 婺源(n=46) 0 0 46 正确判别率(%) 100 100 100 交叉验证 遂川(SC) 42 0 0 99.3 庐山(LS) 0 49 1 婺源(WY) 0 0 46 正确判别率(%) 100 98 100
下载: 导出CSV
表 11 判别分类验证结果
Table 11 Results of discriminant classification test
方法 产地 预测组成员信息 遂川
(SC)庐山
(LS)婺源
(WY)未分组
个案正确判
别率(%)回代
检验遂川(n=42) 42 0 0 100 庐山(n=50) 0 50 0 婺源(n=46) 0 0 46 未分组个案(n=6) 3 0 0 3 正确判别率(%) 100 100 100 100
下载: 导出CSV
-
[1] 邱水文. 关于我省加快油茶产业发展情况的报告[R]. 南昌:江西省人民政府, 2020. https://jxrd.jxnews.com.cn/system/2020/12/14/019129706.shtml. [QIU S W. Report on accelerating the development of Camellia oleifera industry in our province[R]. Nanchang:The Government of the People's Republic of China of province, 2020.https://jxrd.jxnews.com.cn/system/2020/12/14/019129706.shtml.] QIU S W. Report on accelerating the development of Camellia oleifera industry in our province[R]. Nanchang: The Government of the People's Republic of China of province, 2020.https://jxrd.jxnews.com.cn/system/2020/12/14/019129706.shtml.
[2] 王波, 任向东, 李秀龙, 等. “常乐”稀土微肥对糯玉米冠层光合特性及产量的影响[J]. 中国稀土学报,2012,30(4):488−495. [WANG B, REN X D, LI X L, et al. Effects of “Chang Le” micronutrient fertilizer of rare earths on photosynthetic characteristics of canopy and yield of waxy maize[J]. Journal of the Chinese Society of Rare Earths,2012,30(4):488−495.] WANG B, REN X D, LI X L, et al. Effects of “Chang Le” micronutrient fertilizer of rare earths on photosynthetic characteristics of canopy and yield of waxy maize[J]. Journal of the Chinese Society of Rare Earths, 2012, 30(4): 488−495.
[3] PANG X, LI D C, PENG A. Application of rare-earth elements in the agriculture of China and environmental behavior in soil[J]. Environmental Science and Pollution Research,2001,1(2):124−135. doi: 10.1007/BF02987718
[4] HU Z Y, RICHTER H, SPAROVEK G, et al. Physical logical and biochemical effects of rare earth elements on plants and their agricultural significance:A review[J]. Journal of Plant Nutrition,2007,27(1):186−198.
[5] 曹正志, 吴焦贵, 邓汝温. 稀土化合物的药理学作用[J]. 化学通报, 1986(11):28−39. [CAO Z Z, WU J G, DENG R W. Pharmacological effects of rare earth compounds[J]. Chemistry Bulletin, 1986(11):28−35.] CAO Z Z, WU J G, DENG R W. Pharmacological effects of rare earth compounds[J]. Chemistry Bulletin, 1986(11): 28−35.
[6] 倪瑾, 孟祥顺, 蔡建明, 等. Schiff 碱稀土金属配合物对辐射导致肿瘤细胞DNA损伤及修复的影响[J]. 中华放射医学与防护杂志,2000,20(1):46−55. [NI J, MENG X S, CAI J M, et al. Effects of rare earth complexes with Schiff base on radiation-induced DNA damage and repair of tumor cells[J]. Chinese Journal of Radiology,2000,20(1):46−55.] NI J, MENG X S, CAI J M, et al. Effects of rare earth complexes with Schiff base on radiation-induced DNA damage and repair of tumor cells[J]. Chinese Journal of Radiology, 2000, 20(1): 46−55.
[7] 陈祖义. 稀土元素的脑部积累性、毒性及其对人群健康的潜在危害[J]. 农业生态环境,2005,21(4):72−81. [CHEN Z Y. Accumulation and toxicity of rare earth elements in brain and their potential on health[J]. Rural Eco-Environment,2005,21(4):72−81.] CHEN Z Y. Accumulation and toxicity of rare earth elements in brain and their potential on health[J]. Rural Eco-Environment, 2005, 21(4): 72−81.
[8] 陈祖义, 朱旭东. 稀土元素的骨蓄积性、毒性及对人群健康的潜在危害[J]. 生态与农业环境学报,2008,24(1):88−96. [CHEN Z Y, ZHU X D. Accumulation of rare earth elements in bone and its toxicity and potential hazard to health[J]. Journal of Ecology and Rural Environment,2008,24(1):88−96.] CHEN Z Y, ZHU X D. Accumulation of rare earth elements in bone and its toxicity and potential hazard to health[J]. Journal of Ecology and Rural Environment, 2008, 24(1): 88−96.
[9] 冯嘉, 张辉, 朱为方, 等. 稀土高背景区稀土生物学效应研究Ⅰ轻稀土区人群血液生化指标[J]. 中国稀土学报,2000,18(4):356−367. [FENG J, ZHANG H, ZHU W F, et al. Bio-effect of rare earths in re-high background regionⅠ. Some blood biochemical indices from population resided in light REE district[J]. Journal of the Chinese Society of Rare Earths,2000,18(4):356−367.] FENG J, ZHANG H, ZHU W F, et al. Bio-effect of rare earths in re-high background regionⅠ. Some blood biochemical indices from population resided in light REE district[J]. Journal of the Chinese Society of Rare Earths, 2000, 18(4): 356−367.
[10] KOWALCZYK E, GIVELET L, AMLUND H, et al. Risk assessment of rare earth elements, antimony, barium, boron, lithium, tellurium, thallium and vanadium in teas[J]. EFSA Journal,2022,20:2004−2011.
[11] 马婉君, 马士成, 章剑扬, 等. 六堡茶中稀土元素及矿质元素含量特征分析[J]. 食品安全质量检测学报,2022,13(7):2343−2348. [MA W J, MA S C, ZHANG J Y, et al. Content characteristics analysis of the rare earth elements and mineral elements in Liupao tea[J]. Journal of Food Safety and Quality,2022,13(7):2343−2348.] MA W J, MA S C, ZHANG J Y, et al. Content characteristics analysis of the rare earth elements and mineral elements in Liupao tea[J]. Journal of Food Safety and Quality, 2022, 13(7): 2343−2348.
[12] LAGAD R A, SINGH S K, RAI V K. Rare earth elements and 87Sr/86Sr isotopic characterization of Indian Basmati rice as potential tool for its geographical authenticity[J]. Food Chemistry,2017,217:254−265. doi: 10.1016/j.foodchem.2016.08.094
[13] GUO W, WANG R, WANG W X, et al. Rapid determination of toxic and rare-earth elements in teas by particle nebulization-ICP/MS[J]. Journal of Food Composition and Analysis,2020,91:2357−2369.
[14] WANG H B, CHEN X T, YE J H, et al. Analysis of the absorption and accumulation characteristics of rare earth elements in Chinese tea[J]. Journal of the Science of Food and Agriculture,2020,100:3360−3369. doi: 10.1002/jsfa.10369
[15] 王洁, 伊晓云, 倪康, 等. 基于稀土元素指纹的扁形茶产地判别分析[J]. 浙江农业科学,2016,57(7):1118−1124. [WANG J, YI X Y, NI K, et al. The origin of flat tea based on the fingerprints of rare earth elements[J]. Journal of Zhejiang Agricultural Sciences,2016,57(7):1118−1124.] WANG J, YI X Y, NI K, et al. The origin of flat tea based on the fingerprints of rare earth elements[J]. Journal of Zhejiang Agricultural Sciences, 2016, 57(7): 1118−1124.
[16] 罗钦, 吕军, 黄锐敏, 等. 基于稀土元素指纹分析技术溯源我国茶叶产地的研究进展[J]. 福建农业科技,2022,53(7):67−74. [LUO Q, LÜ J, HUANG R M, et al. Research progress on the traceability of tea origin in china based on the fingerprint analysis technology of rare earth elements[J]. Fujian Agricultural Science and Technology,2022,53(7):67−74.] LUO Q, LÜ J, HUANG R M, et al. Research progress on the traceability of tea origin in china based on the fingerprint analysis technology of rare earth elements[J]. Fujian Agricultural Science and Technology, 2022, 53(7): 67−74.
[17] 李安, 陈秋生, 赵杰, 等. 基于稳定同位素与稀土元素指纹特征的大桃产地判别分析[J]. 食品科学,2020,42(6):322−328. [LI A, CHEN Q S, ZHAO J, et al. Discrimination of the geographical origin of peach based on stable isotope and rare earth element fingerprint characteristics[J]. Food Science,2020,42(6):322−328.] LI A, CHEN Q S, ZHAO J, et al. Discrimination of the geographical origin of peach based on stable isotope and rare earth element fingerprint characteristics[J]. Food Science, 2020, 42(6): 322−328.
[18] 刘春娥, 林烘, 宋雁, 等. 基于稀土元素指纹分析技术的紫菜产地溯源[J]. 食品工业科技,2016,37(10):57−61. [LIU C E, LIN H, SONG Y, et al. Geographical origin traceability of laver based on rare earth element fingerprints[J]. Science and Technology of food Industry,2016,37(10):57−61.] LIU C E, LIN H, SONG Y, et al. Geographical origin traceability of laver based on rare earth element fingerprints[J]. Science and Technology of food Industry, 2016, 37(10): 57−61.
[19] MA G C, ZHANG Y B, ZHANG J Y, et al. Determining the geographical origin of Chinese green tea by linear discriminant analysis of trace metals and rare earth elements:Taking Dongting Biluochun as an example[J]. Food Control,2016,59:714−720. doi: 10.1016/j.foodcont.2015.06.037
[20] ZHAO H Y, YANG Q G. The suitability of rare earth elements for geographical traceability of tea leaves[J]. Journal of the Science of Food and Agriculture,2019,99(14):6509−6514. doi: 10.1002/jsfa.9930
[21] 吴海燕, 徐芝亮. 基于主成分分析和判别分析的广地龙产地溯源研究[J]. 药物分析杂志,2022,42(3):387−392. [WU H Y, XU Z L. Provenance traceability of earthworm based on the principal component analysis and discriminant analysis[J]. Chinese Journal of Pharmaceutical Analysis,2022,42(3):387−392.] WU H Y, XU Z L. Provenance traceability of earthworm based on the principal component analysis and discriminant analysis[J]. Chinese Journal of Pharmaceutical Analysis, 2022, 42(3): 387−392.
[22] 熊欣, 刘嘉飞, 蔡展帆, 等. 主成分分析技术对葡萄酒产地进行溯源[J]. 食品药品安全质量检测学报,2020,16(8):5477−5484. [XIONG X, LIU J F, CAI Z F, et al. Trace of geographical origin of wine by principal component analysis[J]. Journal of Food Safety and Quality,2020,16(8):5477−5484.] XIONG X, LIU J F, CAI Z F, et al. Trace of geographical origin of wine by principal component analysis[J]. Journal of Food Safety and Quality, 2020, 16(8): 5477−5484.
[23] 李彩虹, 开建荣, 王彩艳, 等. 基于矿物元素技术的品种、产区葡萄酒的判别分析[J]. 食品与发酵工业,2022,48(12):281−287. [LI C H, KAI J R, WANG C Y, et al. Discriminant analysis of wine variety and origin based on the content of mineral elements[J]. Food and Fermentation Industries,2022,48(12):281−287.] LI C H, KAI J R, WANG C Y, et al. Discriminant analysis of wine variety and origin based on the content of mineral elements[J]. Food and Fermentation Industries, 2022, 48(12): 281−287.
[24] 周艳超, 薛坤, 葛海燕, 等. 基于主成分与聚类分析的樱桃番茄品质综合评价[J]. 浙江农业学报,2021,33(12):2320−2329. [ZHOU Y C, XUE K, GE H Y, et al. Comprehensive evaluation of cherry tomato quality based on principal component analysis and cluster analysis[J]. Acta Agriculture Zhejianggensis,2021,33(12):2320−2329.] doi: 10.3969/j.issn.1004-1524.2021.12.12 ZHOU Y C, XUE K, GE H Y, et al. Comprehensive evaluation of cherry tomato quality based on principal component analysis and cluster analysis[J]. Acta Agriculture Zhejianggensis, 2021, 33(12): 2320−2329. doi: 10.3969/j.issn.1004-1524.2021.12.12
[25] GUO C C, ZHANG Y F, WU D Y, et al. Principal component analysis to assess the changes of yield and quality in Pinellia ternata at different stages after brassinolide treatments[J]. International Journal of Molecular Sciences,2022,23(23):15375−15382. doi: 10.3390/ijms232315375
[26] RATNAM T, KUMAR B, RAO L, et al. Principal component analysis of yield and quality traits in Zinc rich landraces of rice[J]. Electronic Journal of Plant Breeding,2022,13(4):1162−1169.
[27] 潘丙珍, 庞世琦, 陈秀明, 等. 基于主成分分析和判别分析的咖啡掺假鉴别方法研究[J]. 食品科技,2022,47(11):267−272. [PAN B Z, PANG S Q, CHEN X M, et al. Study of the identification method of coffee adulteration based on principal component analysis and discriminant analysis[J]. Food Science and Technology,2022,47(11):267−272.] PAN B Z, PANG S Q, CHEN X M, et al. Study of the identification method of coffee adulteration based on principal component analysis and discriminant analysis[J]. Food Science and Technology, 2022, 47(11): 267−272.
[28] 张春岭, 刘慧, 刘杰超, 等. 基于主成分分析与聚类分析的中、早熟桃品种制汁品质评价[J]. 食品科学,2019,40(17):141−149. [[ZHANG C L, LIU H, LIU J C, et al. Evaluation of juice quality of mid-early ripening peach varieties based on principal component analysis and cluster analysis[J]. Food Science,2019,40(17):141−149.] [ZHANG C L, LIU H, LIU J C, et al. Evaluation of juice quality of mid-early ripening peach varieties based on principal component analysis and cluster analysis[J]. Food Science, 2019, 40(17): 141−149.
[29] TIAN L X, LI J H, ZHANG L, et al. Discrimination of five species of Panax genus and their geographical origin using electronic tongue combined with chemometrics[J]. World Journal of Traditional Chinese Medicine,2021,7(1):104−110. doi: 10.4103/wjtcm.wjtcm_80_20
[30] BINASHIKHBUBKR K, NAIM D. Stock identification of Kawakawa Euthynnus affinis (Cantor, 1849) from Peninsular Malaysia using discriminant analysis[J]. IOP Conference Series: Earth and Environmental Science,2022,956(1):215−202.
[31] 张腊腊, 韩明虎, 胡浩斌, 等. 基于主成分分析的苹果品质综合评价[J]. 江苏农业科学,2020,48(3):209−213. [[ZHANG L L, HAN M H, HU H B, et al. Comprehensive evaluation of apple quality based on principal component analysis[J]. Jiangsu Agricultural Sciences,2020,48(3):209−213.] [ZHANG L L, HAN M H, HU H B, et al. Comprehensive evaluation of apple quality based on principal component analysis[J]. Jiangsu Agricultural Sciences, 2020, 48(3): 209−213.
-
期刊类型引用(2)
1. 罗玉航,况晓宇,周绍均,袁付明,刘桂岚,阁世媚. 基于多元素分析的贵州绿茶产地鉴别研究. 食品安全质量检测学报. 2024(01): 20-28 .  百度学术
百度学术
2. 王立东,白如霞,王雪梅,谭欣. 绵阳市茶叶中16种稀土元素含量的测定. 天津农业科学. 2024(07): 79-82 . 百度学术
其他类型引用(1)
 下载:
下载:


计量
- 文章访问数: 125
- HTML全文浏览量: 27
- PDF下载量: 23
- 被引次数: 3