Rapid Detection of Pea Protein Adulterated in Beef Based on Near-infrared Hyperspectral Technology
-
摘要: 利用近红外高光谱成像技术结合偏最小二乘模型(PLSR)对牛肉掺入豌豆蛋白进行快速无损检测。将豌豆蛋白按照1%~30%(w/w)的浓度梯度掺入牛肉糜中(掺入浓度间隔1%),共获得93个样品以采集其光谱信息。经移动平均值平滑(Moving average smoothing,MAS)、高斯滤波平滑(Gaussian filter smoothing,GFS)、基线校正(Baseline correction,BC)、S-G卷积平滑(Savitzky Golay convolution smoothing,SGCS)、标准正态变量校正(Standard normal variable correction,SNV)等5种方法预处理光谱信息后,利用PLSR算法构建预测模型。然后采用回归系数法(Regression Coefficient,RC)、逐步回归法(Stepwise)和连续投影算法(Successive Projections Algorithm,SPA)筛选最优波长进行模型优化。结果显示,经过GFS预处理所构建的全波段PLSR模型预测效果更好(R2P=0.87,RMSEP=3.22%,ΔE=1.82,RPD=5.82)。采用RC法从GFS光谱中选取的24个最优波长(908.8、913.7、918.7、928.5、936.8、945.0、961.5、971.3、994.4、1017.4、1033.9、1099.7、1135.8、1167.1、1196.7、1211.5、1453.6、1549.3、1607.1、1633.7、1660.1、1678.4、1683.4和1686.7 nm)建立的优化PLSR模型效果最好(R2P=0.90,RMSEP=2.85%,ΔE=1.13,RPD=6.19)。试验表明,高光谱成像技术可实现豌豆蛋白掺入牛肉的快速无损检测。Abstract: Near-infrared hyperspectral imaging combined with partial least regression (PLSR) models for rapid and non-destructive detection of beef adulterated with pea protein was investigated. The adulteration samples were prepared by mixing pea protein into minced beef with a concentration gradient of 1%~30% (w/w) (interval of 1%), and a total of 93 samples were finally obtained to collect spectral information. After preprocessed by five methods including moving average smoothing (MAS), Gaussian filter smoothing (GFS), baseline correction (BC), Savitzky Golay convolution smoothing (SGCS), and standard normal variable correction (SNV), the spectra were used to construct prediction models by using PLSR algorithm. The regression coefficient (RC), stepwise and successive projections algorithm (SPA) were then used to select optimal wavelength for model optimization. The results showed that the full-band PLSR model constructed by GFS spectra had better prediction performance (R2P=0.87, RMSEP=3.22%, ΔE=1.82, RPD=5.82). The 24 optimal wavelengths including 908.8, 913.7, 918.7, 928.5, 936.8, 945.0, 961.5, 971.3, 994.4, 1017.4, 1033.9, 1099.7, 1135.8, 1167.1, 1196.7, 1211.5, 1453.6, 1549.3, 1607.1, 1633.7, 1660.1, 1678.4, 1683.4 and 1686.7 nm were selected by RC method from the GFS spectra and the original PLSR model optimized with these wavelengths showed better performance (R2P=0.90, RMSEP=2.85%, ΔE=1.13, RPD=6.19). In conclusion, it was possible to use hyperspectral imaging to achieve rapid and non-destructive detection of beef adulterated with pea protein.
-
Keywords:
- near-infrared /
- meat adulteration /
- pea protein /
- hyperspectral imaging /
- partial least squares /
- rapid detection
-
肉中含有丰富的蛋白质、脂肪以及人体正常生命活动所需的各种维生素,是人类饮食的重要组成部分[1]。其中牛肉因其蛋白质含量高、脂肪含量低以及丰富的营养价值而广受消费者的喜爱[2]。近年来,随着居民生活水平的提高以及消费偏好的转变,牛肉的消费量不断增长[3],掺假问题也时有发生。牛肉及其制品掺假通常是掺入其他动物内脏、组织、脂肪或加入非肉源性物质例如植物蛋白等替代肉制品[4-5]。植物蛋白掺入生肉中经过高温蒸煮,蛋白与牛肉合为一体,难以分辨,使其分量增加但成本大大降低,在卤肉制品中较为常见。豌豆蛋白低致敏性的特点,使其在食品材料中有广泛应用,其良好的功能性可以作为部分蛋白的替代品并强化某些食品性质。豌豆蛋白独特的功能特性可以提高肉制品的贮藏时间,改善食品的稳定性[6]。又因其产量丰富且价格低廉,豌豆蛋白常用于掺入牛肉及其制品中。肉及其加工制品掺假不仅会损害消费者的切实利益,还可能会产生过敏现象或掺假物有毒等危害消费者健康的问题[7]。
目前常用的肉制品掺假检测技术有传统的鉴别掺假方法如感官判别,基于蛋白质组学的免疫和质谱技术[8],基于DNA的聚合酶链式反应(PCR)鉴别手段[9],以及环介导等温扩增[10]等。然而这些方法通常需要进行样品制备,并且这些技术均在不同方面有一定的局限性。目前光谱技术的逐步发展经验证可克服这些限制,近红外光谱技术也广泛应用于肉类的无损检测[11]。其中高光谱成像技术作为一种快速的,非接触的分析方法广泛发展,近年来已应用于食品业、农业等方向[12]。
在肉类掺假的无损检测中,高光谱检测技术已有较多应用,如Wang等[13]基于高光谱成像技术快速检测牛肉掺假鸭肉,模型预测效果良好R2P=0.96,RMSEP=6.58%,RPD=4.86。何鸿举等[14]基于近红外高光谱成像技术检测牛肉糜中掺假大豆分离蛋白,模型相关系数RP=0.95,预测性能稳定。在400~1000 nm范围,Kamruzzaman等[15]利用高光谱成像技术检测牛肉糜中掺入鸡肉,R2P=0.97,RMSEP=2.61%,RPD=5.86。本试验主要研究近红外高光谱成像技术对牛肉中掺入豌豆蛋白的快速无损检测。试验以牛肉糜为原料掺入不同比例的豌豆蛋白,获取被测样品的高光谱图像,再对提取的光谱数据进行校正并采集特征波长信息以建立预测模型。本试验研究高光谱成像技术对牛肉糜中豌豆蛋白掺入量预测的可行性,为牛肉掺假的快速检测提供数据支撑。
1. 材料与方法
1.1 材料与仪器
新鲜牛里脊肉 购于河南省新乡市红旗区世纪华联超市,样品采集后立即送入实验室置于0~4 ℃的冰箱中;豌豆蛋白 浙江一诺生物科技有限公司。
HSI-eNIR-XC130型推扫式高光谱成像系统 台湾五铃光电股份有限公司;20040081型Haier冰箱 中国海尔公司;TLE204E/02电子分析天平 梅特勒-托利多仪器有限公司;JR06C-200绞碎机 浙江绍兴苏泊尔生活电器有限公司。
1.2 实验方法
1.2.1 样品预处理
新鲜牛肉去除筋膜,搅成肉糜状;经过预实验可知,在不影响肉糜口感的条件下,将豌豆蛋白与水按照1:3(w/w)的比例复水可以达到掺假的最佳效果。复水后的植物蛋白按照1%~30%(w/w)的浓度梯度掺入牛肉糜中(掺入间隔1%),充分混匀。再制取一个纯牛肉样品和纯豌豆蛋白样品,用于对比分析掺假样品的光谱反射率,每个浓度梯度制备三个平行样品,共获得93个样品用于高光谱扫描。
1.2.2 高光谱数据采集
试验前将高光谱设备进行预热,待光源稳定后再开始扫描。设备稳定后对高光谱仪器进行参数设定以及黑白板校准来减少试验误差。具体参数设定如下:波长扫描范围900~1700 nm,载物台移动速度为7.27 mm/s,光谱的曝光时间为4.25 ms,扫描间距为100 nm。
1.2.3 光谱数据的提取与预处理
通过HSI Analyzer软件校正所得的高光谱图像,提取图像中感兴趣区域(ROI)内的光谱信息,计算所有像素点信息的平均值作为每个样品的平均光谱数据[16],得到不同掺入比例样品的光谱数据。采集的原始数据会附带外界的干扰和噪声信息,影响样品数据的真实性。为了减少这种干扰,本试验选用了移动平均值平滑(Moving average smoothing, MAS)、高斯滤波平滑(Gaussian filter smoothing, GFS)、基线校正(Baseline correction, BC)、S-G卷积平滑(Savitzky Golay convolution smoothing, SGCS)、标准正态变量校正(Standard normal variable correction, SNV)这5种光谱处理方法对原始数据进行预处理[17-19],以提高模型的精度与稳定性。
1.2.4 模型的构建与评价
将光谱数据预处理后,使每组数据与掺假比例一一对应,再按照掺假比例的大小进行排列,按3:1的比例,将样品数据分为校正集与验证集,其中校正集与验证集的个数分别为70与23个。校正集用于模型的建立,而验证集用于模型性能的验证。数据集合划分后,将掺入比例作为因变量,波长的反射率作为自变量,基于偏最小二乘(Partial least squares,PLS)算法构建模型。本试验模型采用决定系数(R2)、均方根误差(Root mean square error,RMSE)和剩余预测偏差(Residual predictive deviation,RPD)来对预测模型评价。评价模型本身预测性能大小的指标是校正集与交叉验证集的决定系数(R2C,R2CV)、校正集均方根误差(RMSEC)、交叉验证集均方根误差(RMSECV)。对于验证集决定系数(R2P)、预测均方根误差(RMSEP)、鲁棒性(ΔE)、剩余预测偏差(RPD)可用为模型预测性能评价指标,是模型的主要参考标准[20]。其中,决定系数越接近于1,且均方根误差越低,则模型精度越好;当三者的决定系数越接近,且ΔE越小,RPD越大,则模型越稳健,其预测效果也越好[21]。
1.2.5 最优波长的选择与模型优化
本试验所选取的全波段光谱(900~1700 nm)共包含486个波长,数据信息量大的同时也包含冗余信息,会对模型的运算速度有所影响,同时也会在一定程度上干扰模型性能。本试验采用了回归系数法[22](Regression Coefficient, RC)、逐步回归法[23](Stepwise)和连续投影算法[24](Successive Projections Algorithm, SPA)进行最优波长的筛选。
1.3 数据处理
偏最小二乘模型与回归系数法筛选最优波长在The Unscrambler 9.7软件中进行,逐步回归法与连续投影算法筛选最优波长在 MATLAB2016a中进行。
2. 结果与分析
2.1 样品光谱曲线特征
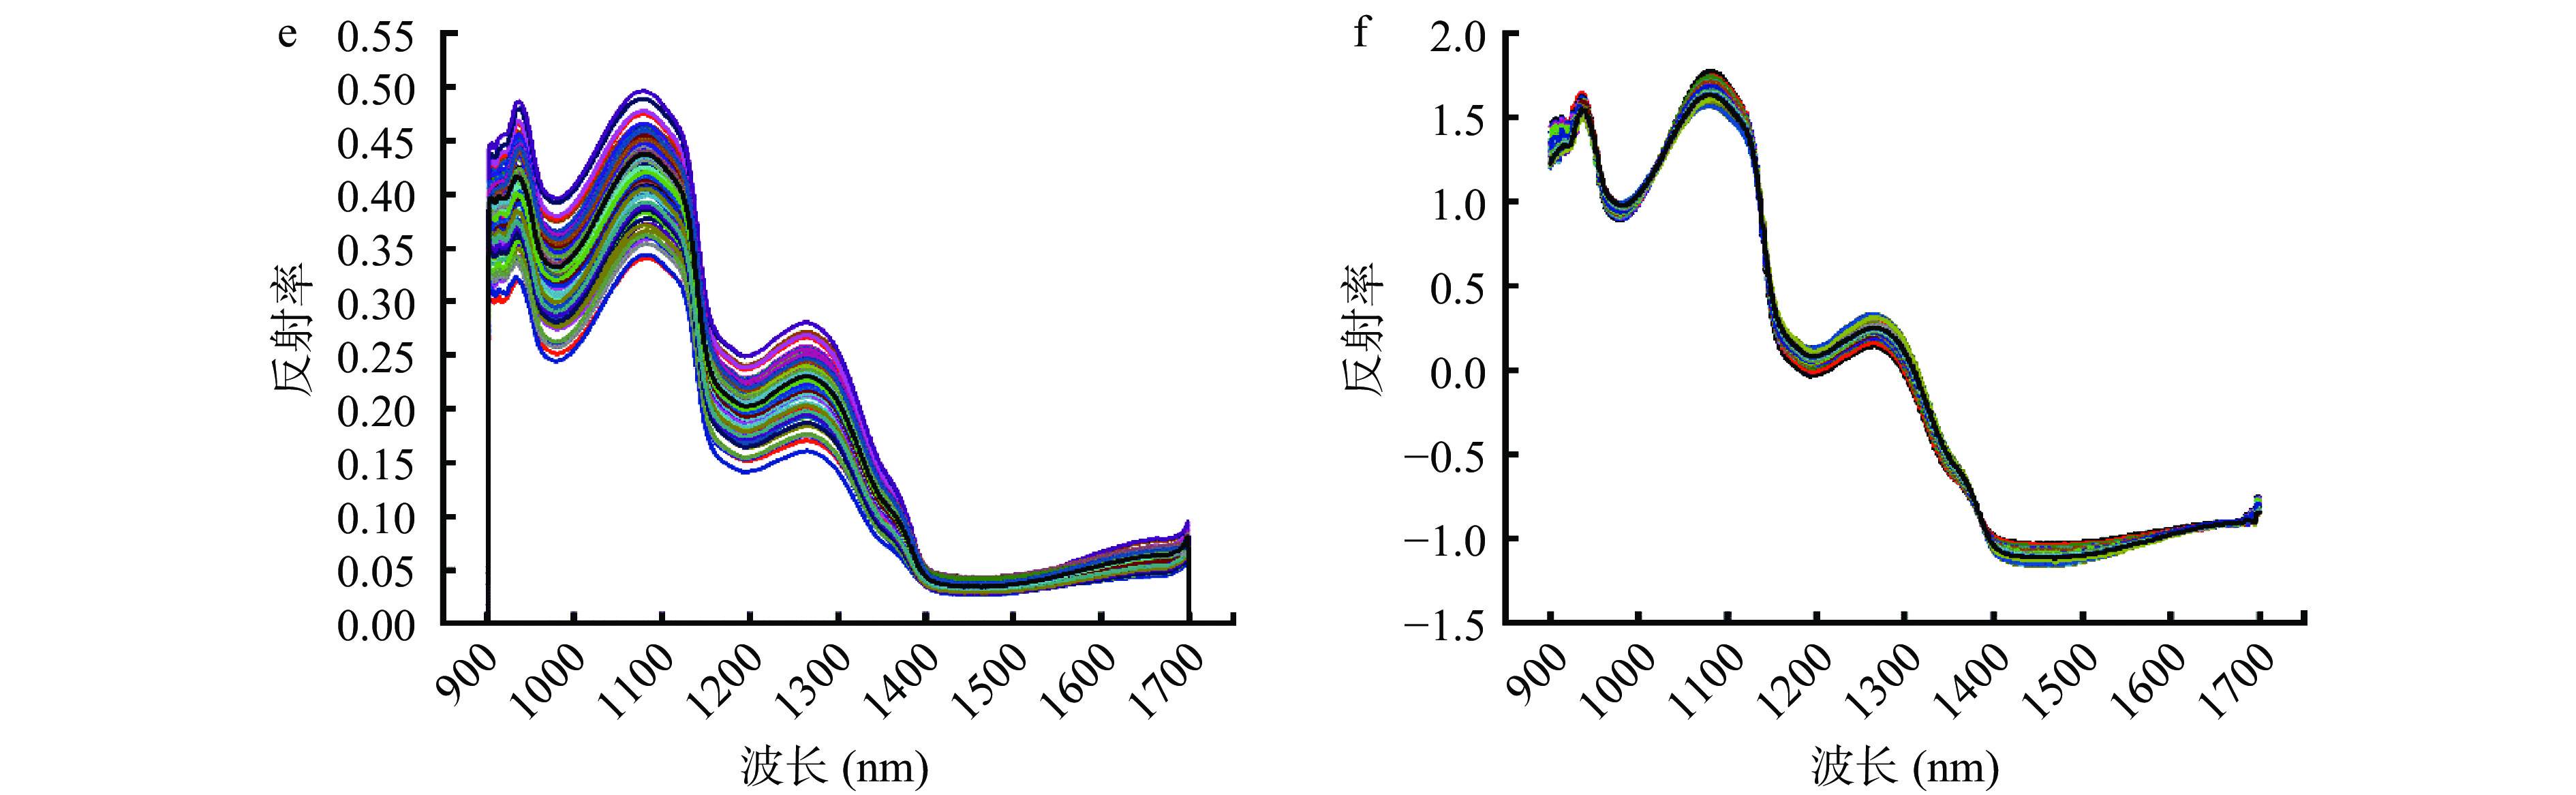
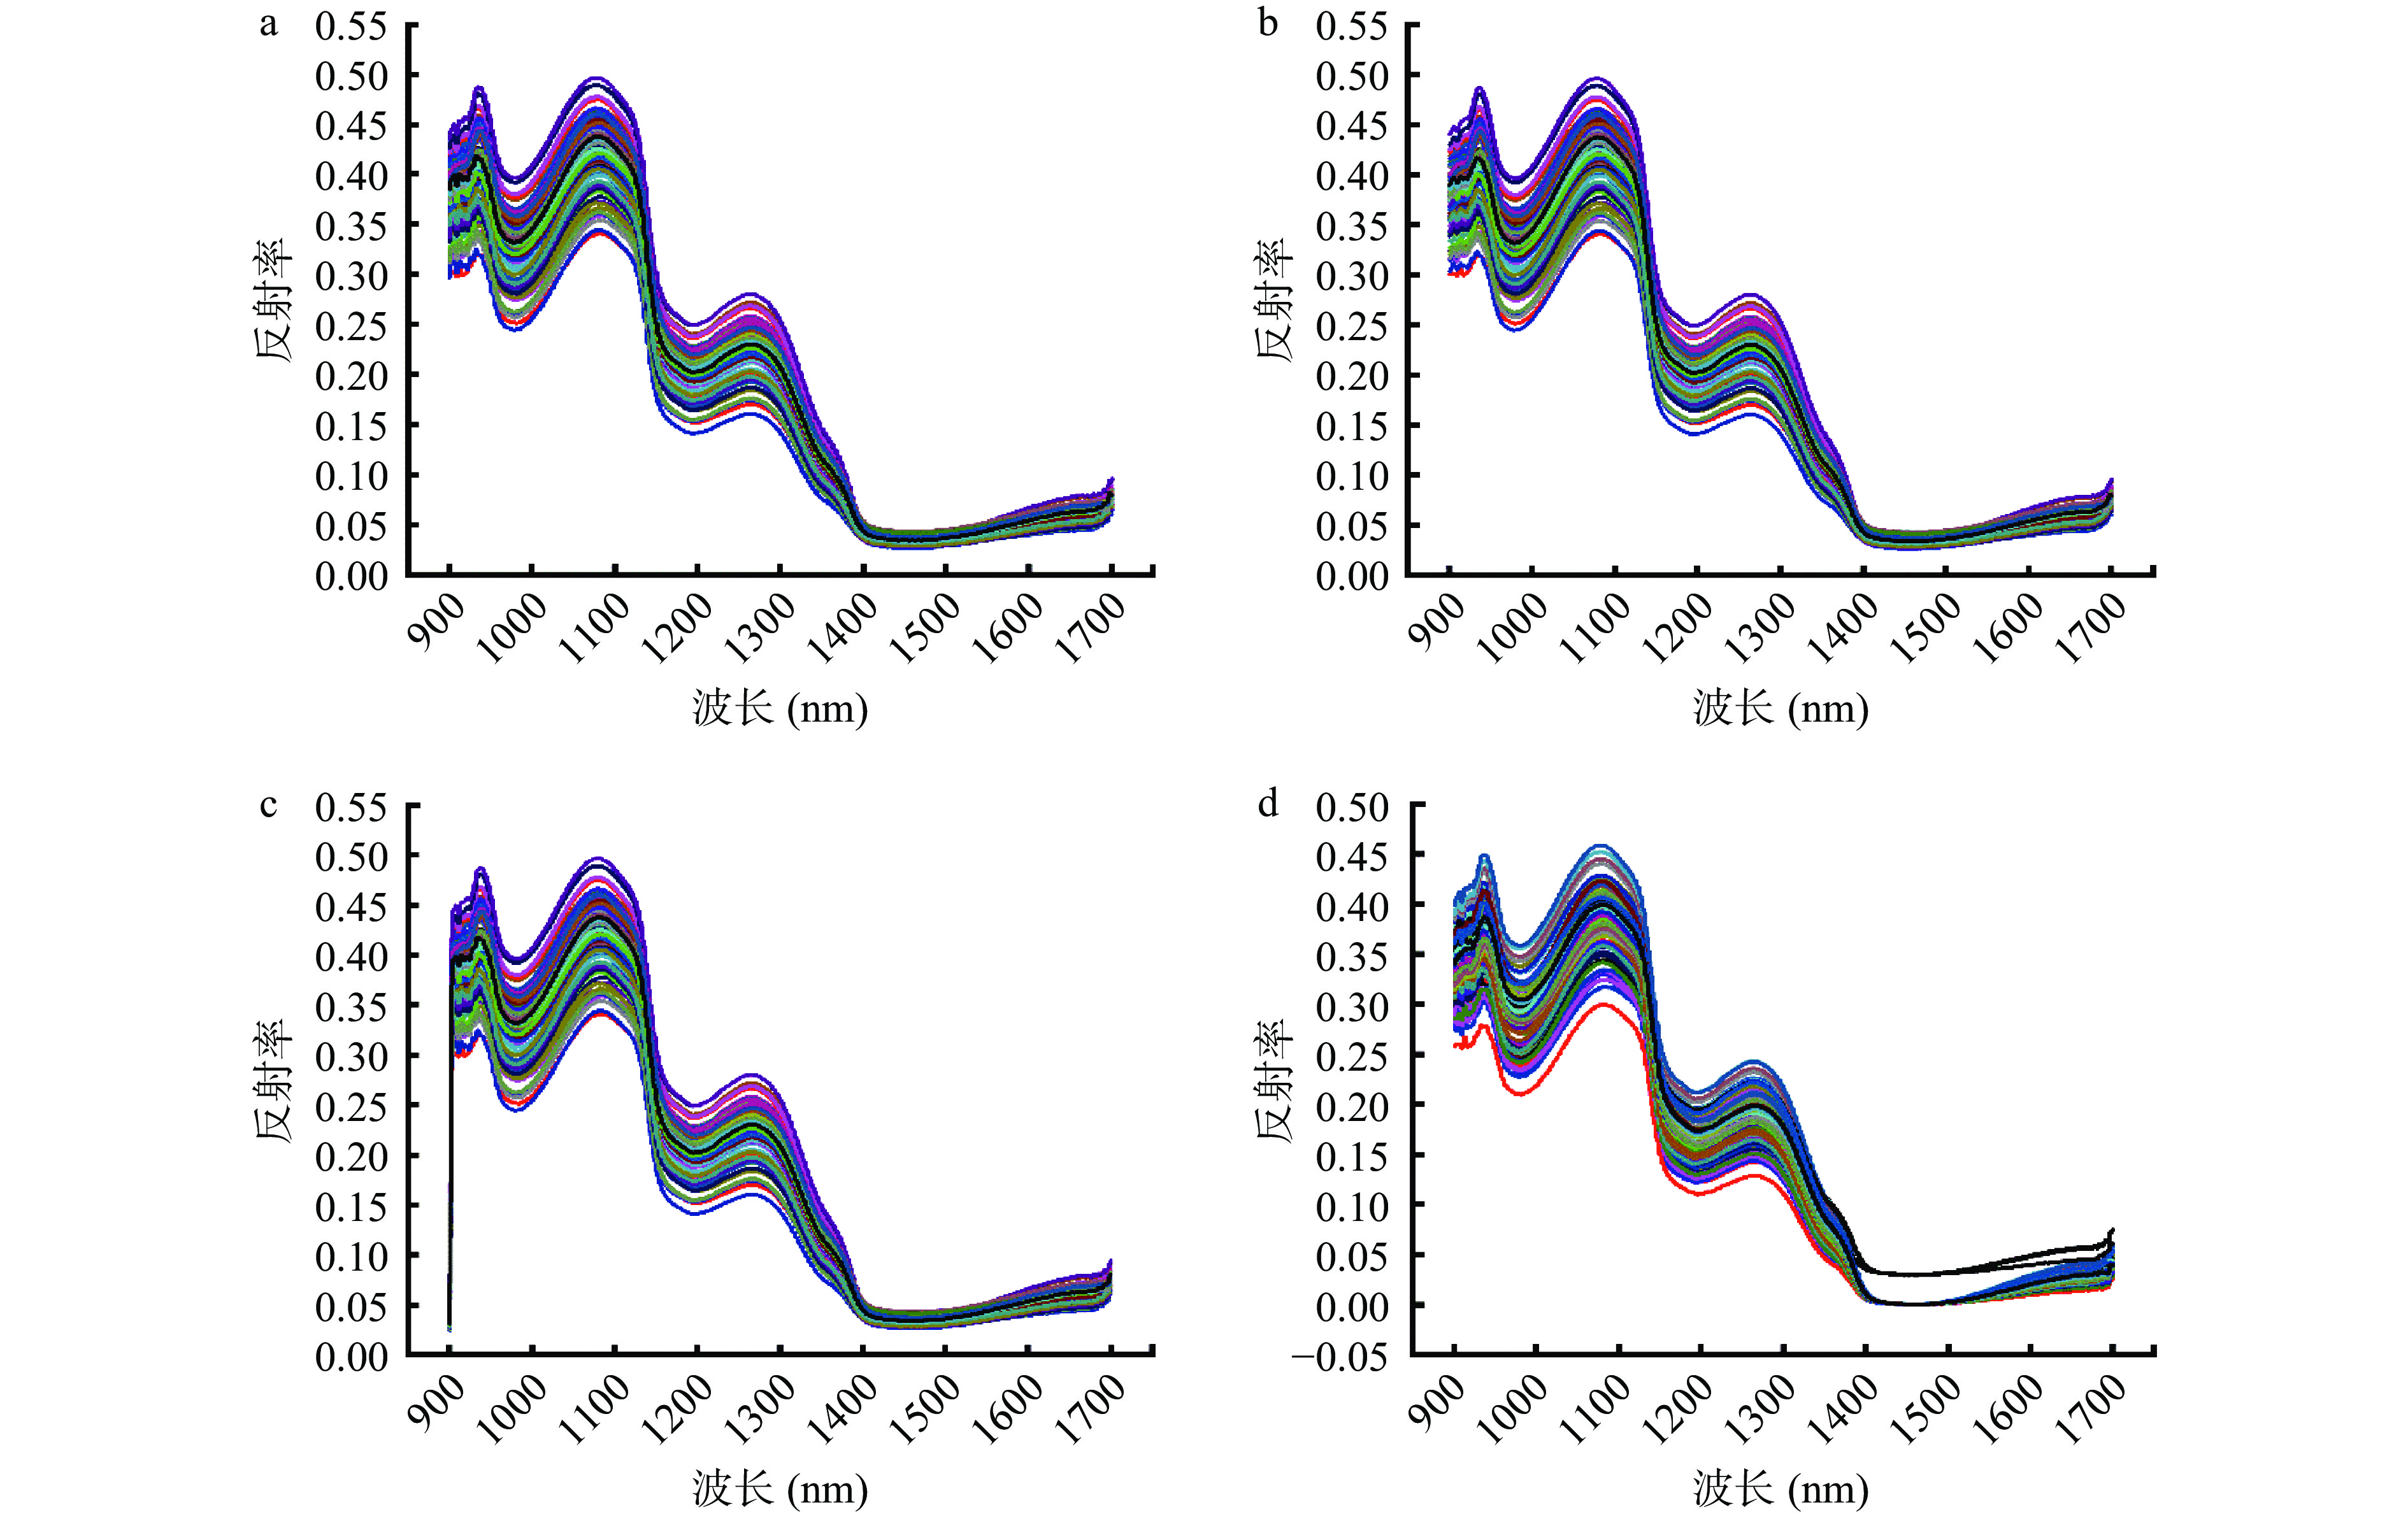
通过使用高光谱系统的HSI Analyzer软件所得到的93个样品的原始平均光谱特征与经过5种不同方法预处理的平均光谱特征如图1所示。在所需波段中,不论经过哪种预处理,样品的光谱曲线总体走势相似,在980、1200和1450 nm处有吸收峰。980和1450 nm处出现的吸收峰是由于水分中O-H键吸收[25],1200 nm处所呈现的吸收峰是C-H键(脂肪)的第二泛音振动吸收所导致[26]。
![]() 图 1 豌豆蛋白掺牛肉样品的光谱特征注:a:原始光谱;b:MAS光谱;c:GFS光谱;d:BC光谱;e:SGCS光谱;f:SNV光谱。Figure 1. Spectral curve of adulterated beef samples with pea protein
图 1 豌豆蛋白掺牛肉样品的光谱特征注:a:原始光谱;b:MAS光谱;c:GFS光谱;d:BC光谱;e:SGCS光谱;f:SNV光谱。Figure 1. Spectral curve of adulterated beef samples with pea protein2.2 全波段偏最小二乘模型
本试验利用5种不同的预处理方法处理900~1700 nm范围内的486个光谱数据,采用PLS回归算法建立豌豆蛋白掺牛肉的全波段偏最小二乘模型,结果如表1所示。
表 1 全波段偏最小二乘模型预测牛肉掺入豌豆蛋白结果Table 1. Full wavelengths PLS models for predicting beef with pea protein预处理 波长数 LVs 校正集 交叉验证集 验证集 ΔE RPD R2C RMSEC(%) R2CV RMSECV(%) R2P RMSEP(%) RAW 486 14 0.98 1.37 0.92 2.60 0.86 3.32 1.95 5.72 MAS 486 12 0.96 1.77 0.89 2.95 0.82 3.76 1.99 5.28 GFS 486 13 0.98 1.40 0.91 2.75 0.87 3.22 1.82 5.82 BC 486 11 0.95 1.99 0.89 3.03 0.78 4.24 2.25 4.80 SGCS 486 11 0.95 2.01 0.89 3.04 0.83 3.61 1.60 5.43 SNV 486 8 0.92 2.49 0.86 3.38 0.80 3.93 1.44 5.11 注:RAW:原始光谱;MAS:移动平均值平滑;GFS:高斯滤波平滑;BC:基线校正;SGCS:S-G卷积平滑;SNV:标准正态变量校正;LVs:潜在变量数;R2C:校正集决定系数;R2CV:交叉验证集决定系数;R2P:验证集决定系数;RMSEC:校正集均方根误差;RMSECV:交叉验证集均方根误差;RMSEP:验证集均方根误差;ΔE:鲁棒性;RPD:预测偏差。 由表1可看出,基于原始光谱数据与5种预处理数据所构建的偏最小二乘模型结果相近,所有模型的预测性能均较好。综合比较可知经过GFS预处理所建立的PLSR模型具有更好的预测结果,其中R2P为0.87,RMSEP最小为3.22%,ΔE为1.82,RPD最大为5.82,表明所建立的模型精确度较高,鲁棒性较好。因此,选用GFS预处理后的光谱数据进行后续的波长筛选以及模型优化。
2.3 特征波长筛选
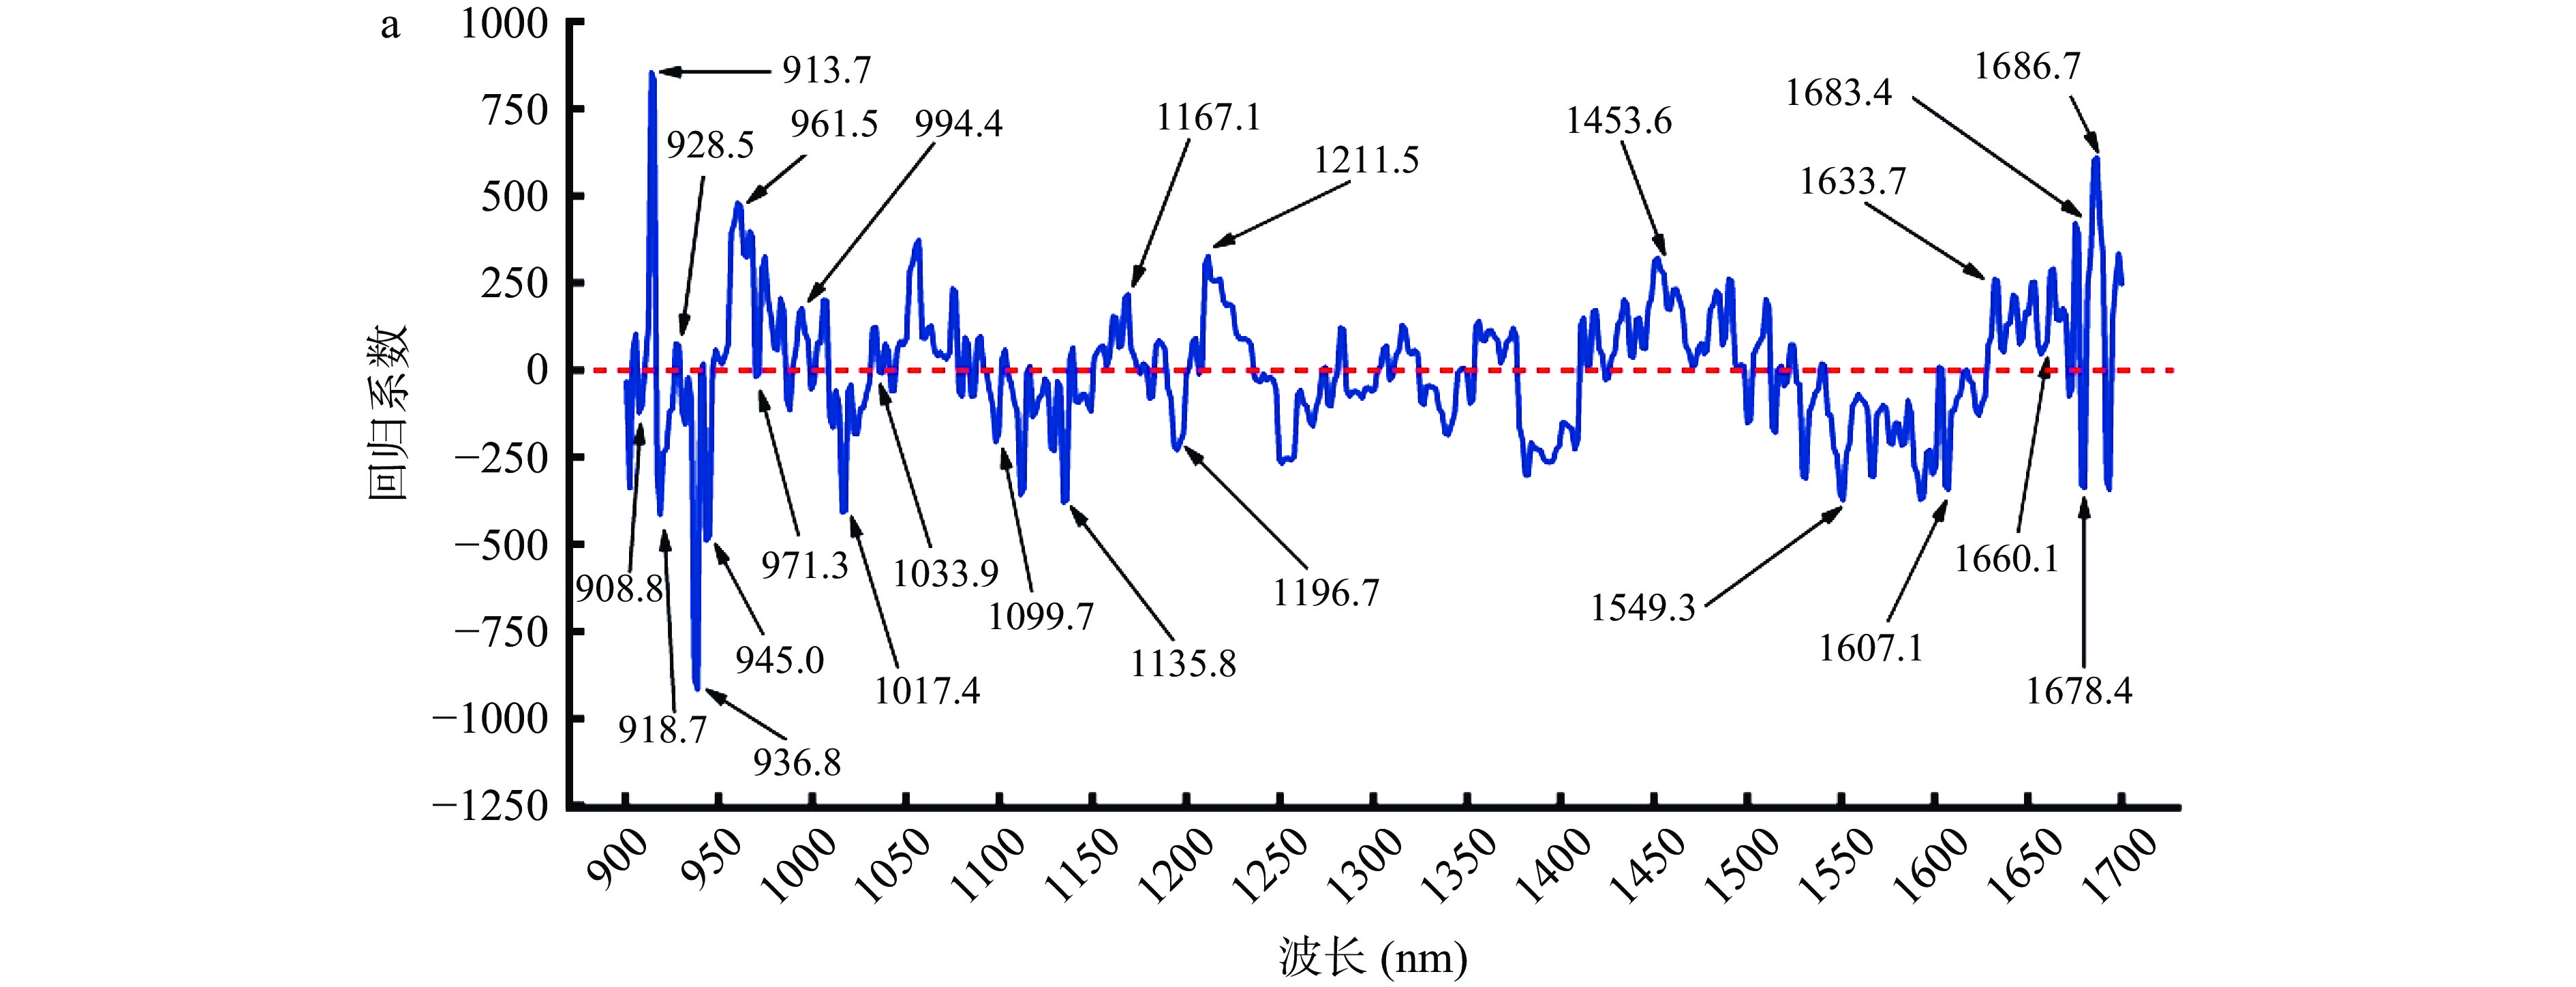
由表1可看出全波段波长所建立的牛肉掺豌豆蛋白预测模型已取得良好效果,但为了提高运算效率本试验采用RC、Stepwises、SPA这三种变量选择方法来筛选所需的特征波长。结果如图2所示,在经过GFS预处理后,利用RC筛选出的特征波长分布图为图2a,其特征波长数量为24个,分别为:908.8、913.7、918.7、928.5、936.8、945.0、961.5、971.3、994.4、1017.4、1033.9、1099.7、1135.8、1167.1、1196.7、1211.5、1453.6、1549.3、1607.1、1633.7、1660.1、1678.4、1683.4和1686.7 nm;经过预处理后采用Stepwise筛选出的特征波长分布图为图2b,其特征波长数量为17个,分别为:902.2、912.1、915.4、918.7、961.5、969.7、976.3、999.3、1002.6、1004.3、1007.5、1017.4、1056.9、1066.8、1088.2、1091.4和1093.1 nm;经预处理后利用SPA筛选出的特征波长分布图为图2c,特征波长数量为16个,分别为:900.5、903.8、913.7、926.9、1052.0、1124.3、1157.2、1216.4、1295.4、1438.7、1509.7、1552.6、1565.8、1635.3、1675.1和1680.0 nm,通过这三种方法减少了多余的波长,波长减少率分别为:95.1%、96.5%、96.7%。
![]() 图 2 豌豆蛋白掺牛肉预测模型特征波长分布图注:a:RC法筛选特征波长;b:Stepwise法筛选特征波长;c:SPA法筛选特征波长。Figure 2. Distribution of optimal wavelengths based on adulterated beef samples with pea protein models
图 2 豌豆蛋白掺牛肉预测模型特征波长分布图注:a:RC法筛选特征波长;b:Stepwise法筛选特征波长;c:SPA法筛选特征波长。Figure 2. Distribution of optimal wavelengths based on adulterated beef samples with pea protein models2.4 基于最优波长建立PLS模型预测结果
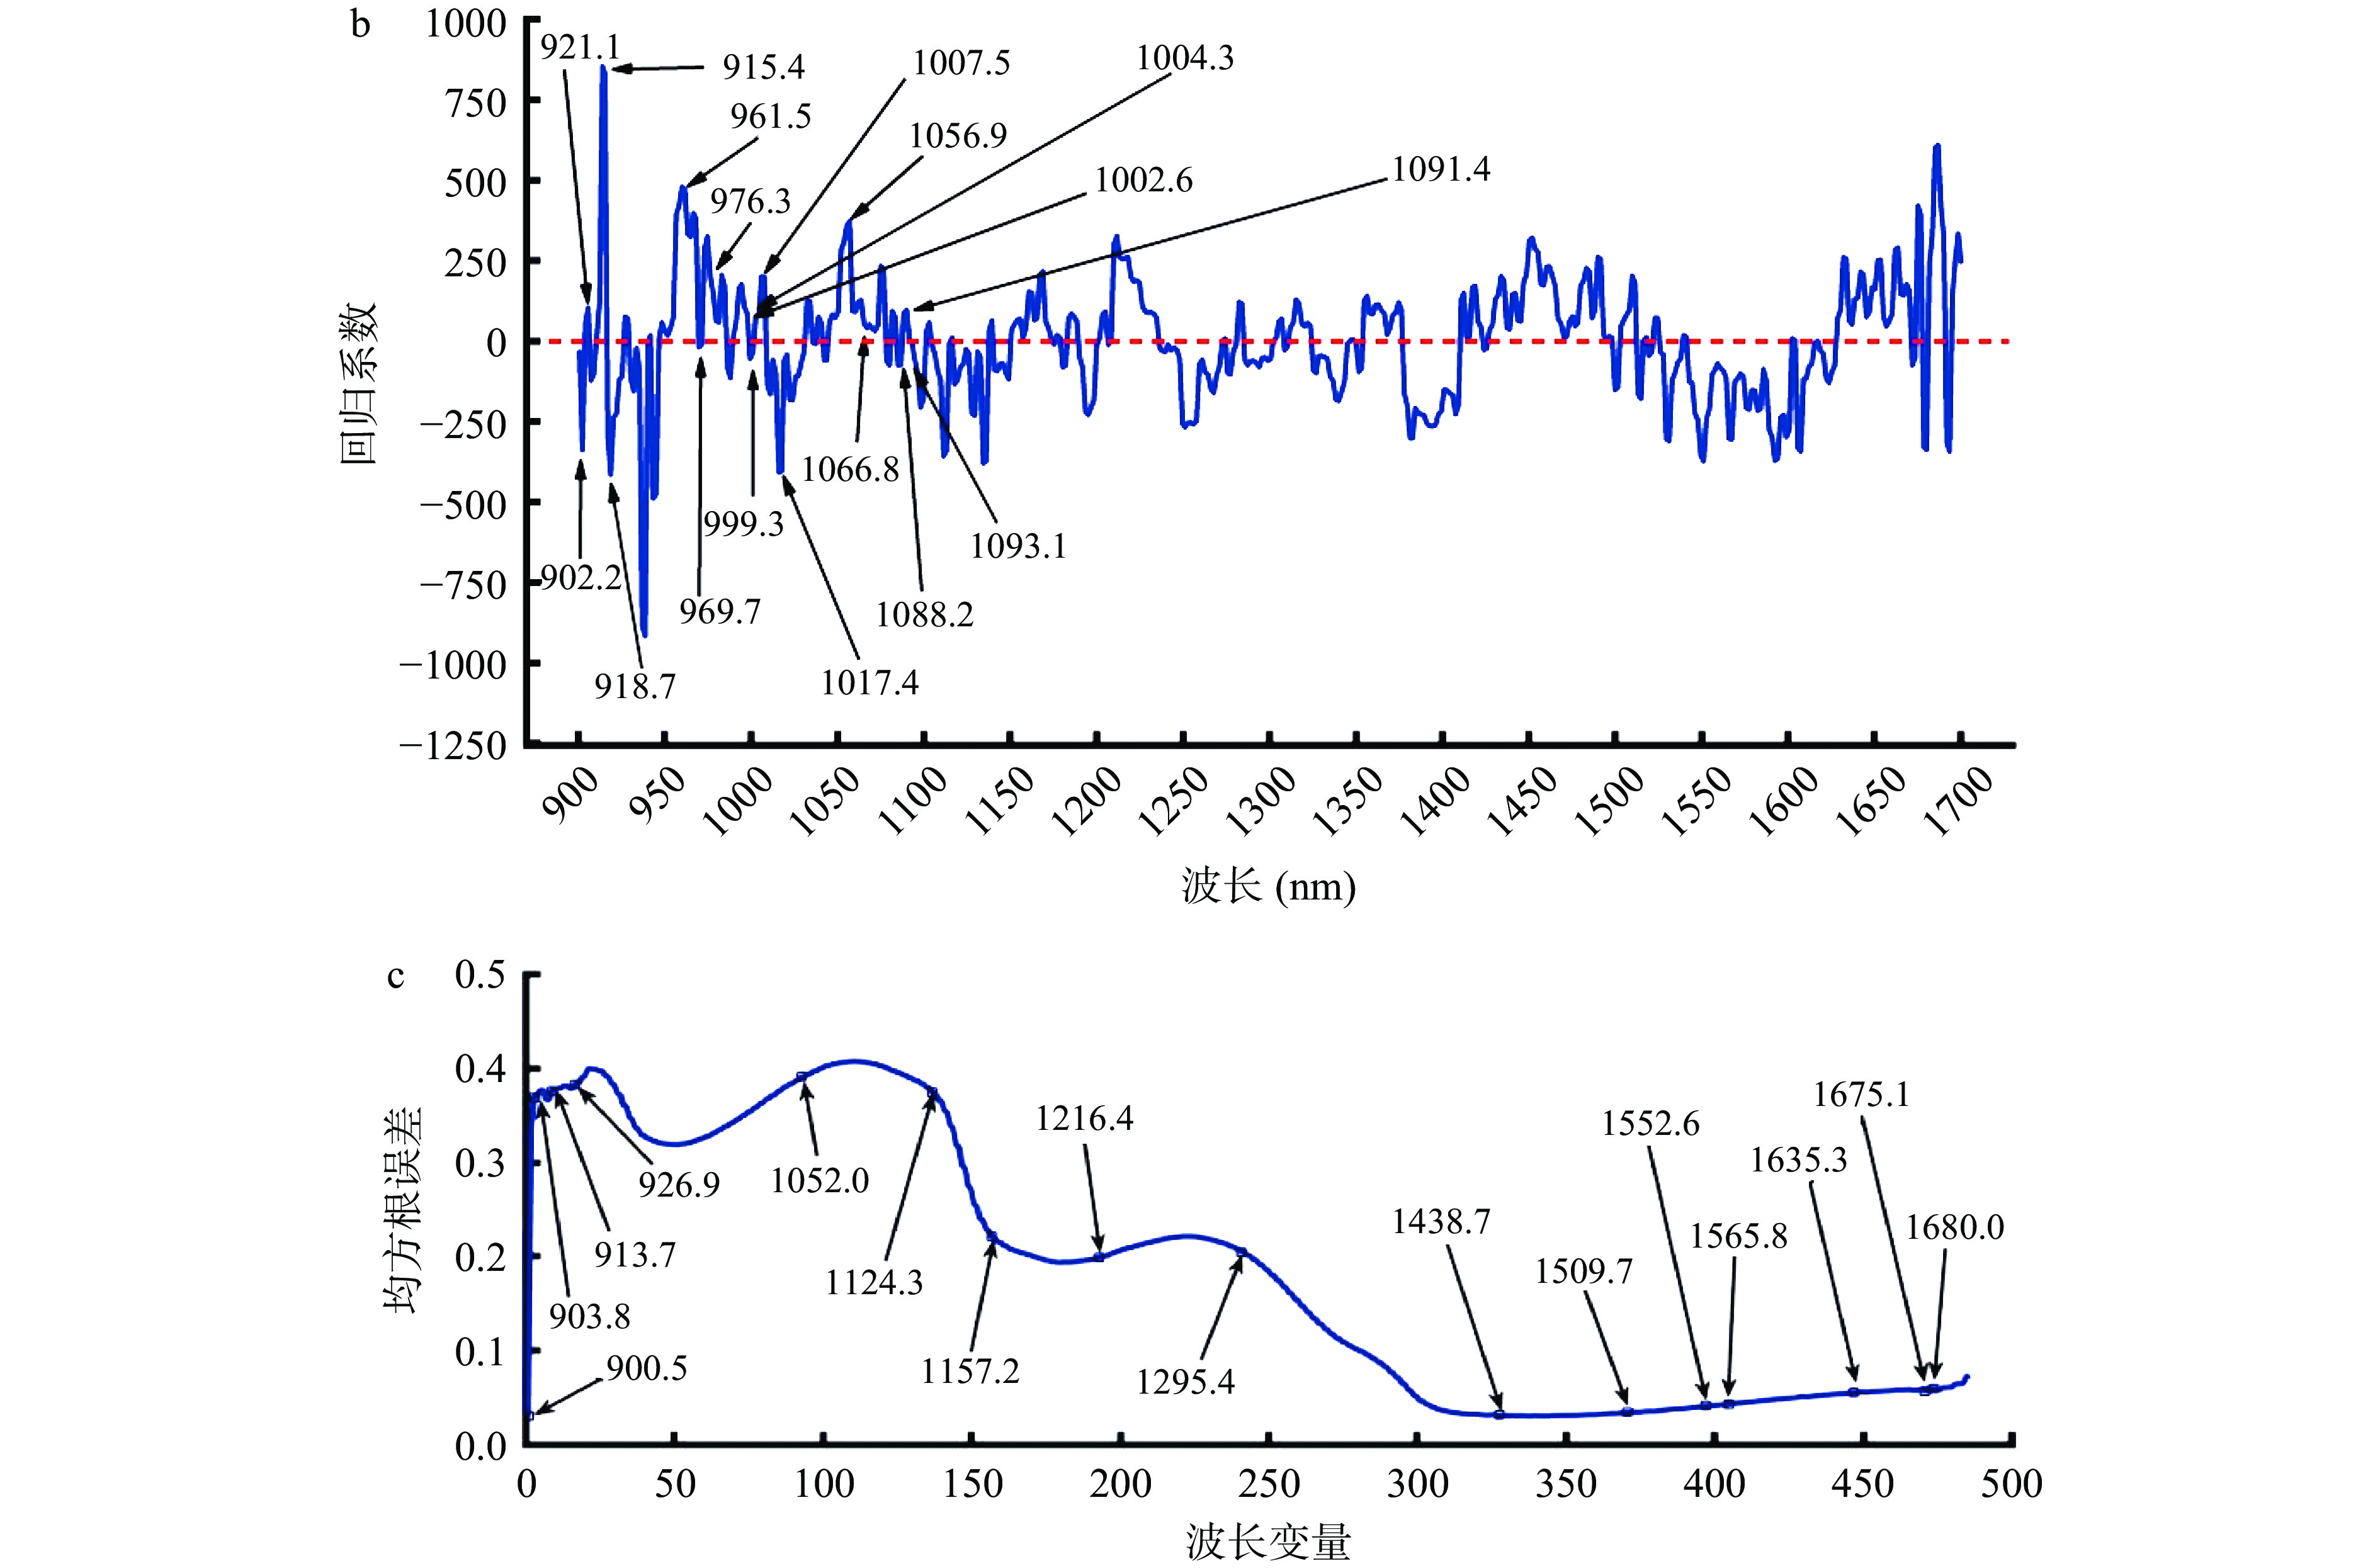
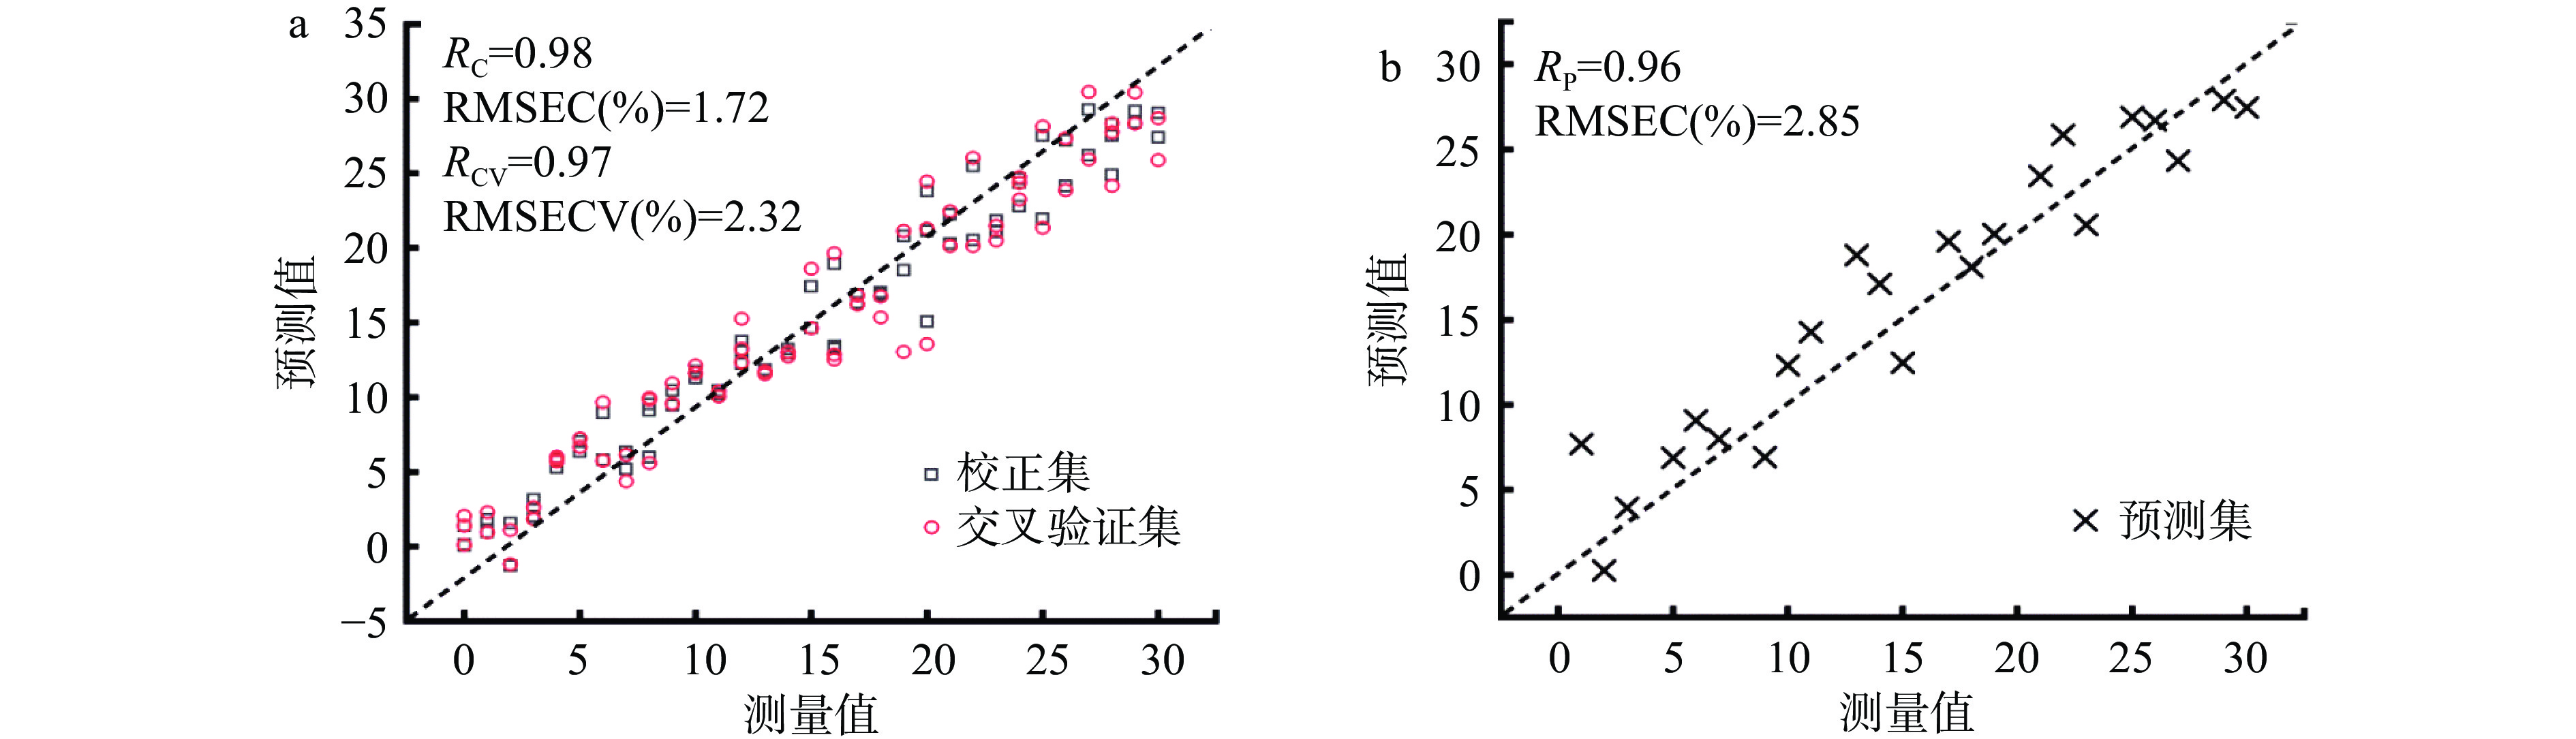
经筛选特征波长后所建立的PLSR模型如下表2和图3所示。三种方法筛选特征波长所建立的模型中,校正集和交叉验证集的决定系数在0.93~0.98之间,说明所建立的模型测量值和预测值相关性很好。由表2可以看出采用回归系数法筛选特征波长后建立的预测模型效果最佳,R2P最大为0.90,RMSEP最小为2.85%,ΔE最小为1.13,RPD最大为6.19,该模型的准确度与鲁棒性最优。经F检验可知1.15<2.05,即F值小于F单尾临界值,说明经F检验得出基于高光谱技术获得的掺假数据与总体数据方差之间没有显著性差异。经t检验可知0.44<2.02,即t值小于t双尾临界值,说明预测值与真实值的均值差异不显著。F检验和t检验进一步证实了模型可实现掺假检验。
表 2 基于特征波长建立的豌豆蛋白掺牛肉简化模型预测结果Table 2. Simplified model of adulterated beef samples with pea protein based on optimal wavelengths预处理 波长选择方法 波长数 校正集 交叉验证集 验证集 ΔE RPD R2C RMSEC(%) R2CV RMSECV(%) R2P RMSEP(%) GFS RC 24 0.96 1.72 0.94 2.32 0.90 2.85 1.13 6.19 GFS Stepwise 17 0.98 1.45 0.94 2.11 0.89 3.00 1.55 6.04 GFS SPA 16 0.96 1.77 0.93 2.31 0.88 3.31 1.54 5.73 注:GFS:高斯滤波平滑;RC:回归系数法;Stepwise:逐步回归法;SPA:连续投影法。 ![]() 图 3 掺假样品最优模型预测结果注:a:校正集与交叉验证集预测结果;b:验证集预测结果。Figure 3. Prediction results of adulterated samples by optimal model
图 3 掺假样品最优模型预测结果注:a:校正集与交叉验证集预测结果;b:验证集预测结果。Figure 3. Prediction results of adulterated samples by optimal model3. 结论
运用近红外高光谱成像技术对牛肉中掺入豌豆蛋白进行快速无损检测。采用5种不同预处理方法(MAS、GFS、BC、SGCS、SNV)建立的全波段PLSR模型中,基于GFS预处理光谱所建立的PLSR模型效果更好。采用RC、Stepwise、SPA等3种不同的方法从GFS光谱中筛选最优波长,其中通过RC法筛选的24个特征波长所建立的优化PLSR模型预测效果最好,R2P为0.90,RMSEP为2.85%,RPD为6.19。后续试验中样品数量、取样方式、数据分析方法、人为操作误差等因素的改善可进一步提升模型的预测性能。总体而言,采用高光谱成像技术结合PLSR模型可实现豌豆蛋白掺入牛肉的快速无损检测。
-
![]()
图 1 豌豆蛋白掺牛肉样品的光谱特征
注:a:原始光谱;b:MAS光谱;c:GFS光谱;d:BC光谱;e:SGCS光谱;f:SNV光谱。
Figure 1. Spectral curve of adulterated beef samples with pea protein
![]()
图 2 豌豆蛋白掺牛肉预测模型特征波长分布图
注:a:RC法筛选特征波长;b:Stepwise法筛选特征波长;c:SPA法筛选特征波长。
Figure 2. Distribution of optimal wavelengths based on adulterated beef samples with pea protein models
![]()
图 3 掺假样品最优模型预测结果
注:a:校正集与交叉验证集预测结果;b:验证集预测结果。
Figure 3. Prediction results of adulterated samples by optimal model
表 1 全波段偏最小二乘模型预测牛肉掺入豌豆蛋白结果
Table 1 Full wavelengths PLS models for predicting beef with pea protein
预处理 波长数 LVs 校正集 交叉验证集 验证集 ΔE RPD R2C RMSEC(%) R2CV RMSECV(%) R2P RMSEP(%) RAW 486 14 0.98 1.37 0.92 2.60 0.86 3.32 1.95 5.72 MAS 486 12 0.96 1.77 0.89 2.95 0.82 3.76 1.99 5.28 GFS 486 13 0.98 1.40 0.91 2.75 0.87 3.22 1.82 5.82 BC 486 11 0.95 1.99 0.89 3.03 0.78 4.24 2.25 4.80 SGCS 486 11 0.95 2.01 0.89 3.04 0.83 3.61 1.60 5.43 SNV 486 8 0.92 2.49 0.86 3.38 0.80 3.93 1.44 5.11 注:RAW:原始光谱;MAS:移动平均值平滑;GFS:高斯滤波平滑;BC:基线校正;SGCS:S-G卷积平滑;SNV:标准正态变量校正;LVs:潜在变量数;R2C:校正集决定系数;R2CV:交叉验证集决定系数;R2P:验证集决定系数;RMSEC:校正集均方根误差;RMSECV:交叉验证集均方根误差;RMSEP:验证集均方根误差;ΔE:鲁棒性;RPD:预测偏差。  下载: 导出CSV
表 2 基于特征波长建立的豌豆蛋白掺牛肉简化模型预测结果
Table 2 Simplified model of adulterated beef samples with pea protein based on optimal wavelengths
预处理 波长选择方法 波长数 校正集 交叉验证集 验证集 ΔE RPD R2C RMSEC(%) R2CV RMSECV(%) R2P RMSEP(%) GFS RC 24 0.96 1.72 0.94 2.32 0.90 2.85 1.13 6.19 GFS Stepwise 17 0.98 1.45 0.94 2.11 0.89 3.00 1.55 6.04 GFS SPA 16 0.96 1.77 0.93 2.31 0.88 3.31 1.54 5.73 注:GFS:高斯滤波平滑;RC:回归系数法;Stepwise:逐步回归法;SPA:连续投影法。
下载: 导出CSV
-
[1] 张小莉, 魏玲, 李宝明, 等. 肉制品掺假鉴别技术研究进展[J]. 食品安全质量检测学报,2014,5(10):3190−3196. [ZHANG X, WEI L, LI M, et al. Research progress of identification techniques for meat products adulteration[J]. Journal of Food Safety and Quality,2014,5(10):3190−3196. ZHANG X, WEI L, LI M. et al. Research progress of identification techniques for meat products adulteration[J]. Journal of Food Safety and Quality, 2014, 5(10): 3190-3196.
[2] 王泳杰, 王之盛, 胡瑞, 等. 不同品种肉牛产肉性能、牛肉营养品质及风味物质的比较[J]. 动物营养学报,2019,31(8):3621−3631. [WANG Y J, WANG Z S, HU R, et al. Comparison of meat performance, nutritional quality and flavor substance in beef of different breeds cattle[J]. Chinese Journal of Animal Nutrition,2019,31(8):3621−3631. WANG Y J, WANG Z S, HU R, et al. Comparison of meat performance, nutritional quality and flavor substance in beef of different breeds cattle[J]. Chinese Journal of Animal Nutrition, 2019, 31(8): 3621-3631.
[3] 朱文博, 陈永福. 世界和中国肉类消费及展望[J]. 农业展望,2018,14(3):98−109. [ZHU B W, CHEN Y F. Meat consumption in the world and China and its prospects[J]. Agricultural Outlook,2018,14(3):98−109. ZHU B W, CHEN Y F. Meat consumption in the world and China and its prospects[J]. Agricultural Outlook, 2018, 14(3): 98-109.
[4] MANE B G, MENDIRATTA S K, TIWARI A K. Beef specific polymerase chain reaction assay for authentication of meat and meat products[J]. Food Control,2012,28(2):246−249. doi: 10.1016/j.foodcont.2012.05.031
[5] RADY A, ADEDEJI A A. Application of hyperspectral imaging and machine learning methods to detect and quantify adulterants in minced meats[J]. Food Analytical Methods,2020,13(4):970−981. doi: 10.1007/s12161-020-01719-1
[6] 夏轩泽, 李言, 钱海峰, 等. 豌豆蛋白乳化性及其改善研究进展[J]. 食品与发酵工业,2021,47(2):279−284. [XIA X Z, LI Y, QIAN H F, et al. Research progress on improvement the emulsification property of pea protein[J]. Food and Fermentation Industries,2021,47(2):279−284. XIA X Z, LI Y, QIAN H F, et al. Research progress on improvement the emulsification property of pea protein[J]. Food and Fermentation Industries, 2021, 47(2): 279-284.
[7] CAVIN C, COTTENET G, BLANCPAIN C, et al. Food adulteration: From vulnerability assessment to new analytical solutions[J]. CHIMIA International Journal for Chemistry,2016,70(5):329−333. doi: 10.2533/chimia.2016.329
[8] MANDLI J, EI FATIMI I, SEDDAOUI N, et al. Enzyme immunoassay (ELISA/immunosensor) for a sensitive detection of pork adulteration in meat[J]. Food Chemistry,2018,255:380−389. doi: 10.1016/j.foodchem.2018.01.184
[9] KANG T S, TANAKA T. Comparison of quantitative methods based on SYBR Green real-time qPCR to estimate pork meat adulteration in processed beef products[J]. Food Chemistry,2018,269:549−558. doi: 10.1016/j.foodchem.2018.06.141
[10] 冼钰茵, 易敏英, 张璜, 等. 环介导等温扩增技术快速检测肉及肉制品中的牛源性成分[J]. 食品工业科技,2016,37(7):278−282. [XIAN Y Y, YI M Y, ZHANG H, et al. Development of loop-mediated isothermal amplification (LAMP) method for rapid detection of bovine in meat and meat products[J]. Science and Technology of Food Industry,2016,37(7):278−282. XIAN Y Y, YI M Y, ZHANG H. Development of loop-mediated isothermal amplification (LAMP) method for rapid detection of bovine in meat and meat products[J]. Science and Technology of Food Industry, 2016, 37(7): 278-282.
[11] HE H J, SUN D W. Microbial evaluation of raw and processed food products by Visible/Infrared, Raman and Fluorescence spectroscopy[J]. Trends in Food Science & Technology,2015,46:199−210.
[12] HE H J, SUN D W. Hyperspectral imaging technology for rapid detection of various microbial contaminants in agricultural and food products[J]. Trends in Food Science & Technology,2015,46(1):99−109.
[13] WANG H, HE H J, MA H J, et al. LW-NIR hyperspectral imaging for rapid prediction of TVC in chicken flesh[J]. International Journal of Agricultural and Biological Engineering,2019,12(3):180−186. doi: 10.25165/j.ijabe.20191203.4444
[14] 何鸿举, 朱亚东, 陈岩, 等. 基于高光谱成像快速检测牛肉糜中大豆分离蛋白掺入量[J]. 食品工业科技,2020,41(20):206−211. [HE H J, ZHU Y D, CHEN Y, et al. Rapid detection of soy protein isolate concentration in minced beef by hyperspectral imaging technology[J]. Science and Technology of Food Industry,2020,41(20):206−211. HE H J, ZHU Y D, CHEN Y, et al. Rapid detection of soy protein isolate concentration in minced beef by hyperspectral imaging technology[J]. Science and Technology of Food Industry, 2020, 41(20): 206-211.
[15] KAMRUZZAMAN M, MAKINO Y, OSHITA S. Rapid and non-destructive detection of chicken adulteration in minced beef using visible near-infrared hyperspectral imaging and machine learning[J]. Journal of Food Engineering,2016,170:8−15. doi: 10.1016/j.jfoodeng.2015.08.023
[16] HE H J, SUN D W. Selection of informative spectral wavelength for evaluating and visualising Enterobacteriaceae contamination of salmon flesh[J]. Food Analytical Methods,2015,8(10):2427−2436. doi: 10.1007/s12161-015-0122-x
[17] WIEDEMAIR V, DE BIASIO M, LEITNER R, et al. Application of design of experiment for detection of meat fraud with a portable Near-Infrared spectrometer[J]. Current Analytical Chemistry,2018,14(1):58−67.
[18] 曾斯杰, 马金爽, 王玥, 等. 基于近红外光谱技术快速检测青金桔果粉中微生物菌数[J]. 海南师范大学学报(自然科学版),2020,33(1):30−35. [ZENG S J, MA J S, WANG Y, et al. Detection of total microorganism counts in kumquat powder by near-infrared spectroscopy[J]. Journal of Hainan Normal University (Natural Science),2020,33(1):30−35. ZENG S J, MA J S, WANG Y, et al. Detection of total microorganism counts in kumquat powder by near-infrared spectroscopy[J]. Journal of Hainan Normal University (Natural Science), 2020, 33(1): 30-35.
[19] SHEN X, LIANG X, YE S, et al. Automatic baseline correction method for the open-path Fourier transform infrared spectra by using simple iterative averaging[J]. Optics Express,2018,26(10):A609−A614. doi: 10.1364/OE.26.00A609
[20] 陈亮亮, 朱亚东, 李梦娇, 等. 基于近红外高光谱成像快速预测牛肉中猪肉掺入量[J]. 海南师范大学学报(自然科学版),2022,35(4):402−406. [CHEN L, ZHU Y, LI M, et al. Fast prediction of pork in beef based on near-infrared hyperspectral imaging[J]. Journal of Hainan Normal University (Natural Science),2022,35(4):402−406. CHEN L, ZHU Y, LI M, et al. Fast prediction of pork in beef based on near-infrared hyperspectral imaging[J]. Journal of Hainan Normal University (Natural Science), 2022, 35(4): 402-406.
[21] ZHU Y D, HE H J, JIANG S Q, et al. Mining hyperspectral data for non-destructive and rapid prediction of nitrite content in ham sausages[J]. International Journal of Agricultural and Biological Engineering,2021,14(2):182−187. doi: 10.25165/j.ijabe.20211402.5407
[22] HE H J, CHEN Y, WANG Y, et al. Hyperspectral imaging combined with chemometrics for rapid detection of talcum powder adulterated in wheat flour[J]. Food Control,2023,144:109378. doi: 10.1016/j.foodcont.2022.109378
[23] HE H J, WANG Y, OU X, et al. Rapid determination of chemical compositions in chicken flesh by mining hyperspectral data[J]. Journal of Food Composition and Analysis,2023,116:105069. doi: 10.1016/j.jfca.2022.105069
[24] HE H J, WANG Y, ZHANG M, et al. Rapid determination of reducing sugar content in sweet potatoes using NIR spectra[J]. Journal of Food Composition and Analysis,2022,111:104641. doi: 10.1016/j.jfca.2022.104641
[25] WANG Y Y, HE H J, JIANG S Q, et al. Nondestructive determination of IMP content in chilled chicken based on hyperspectral data combined with chemometrics[J]. International Journal of Agricultural and Biological Engineering,2022,15(1):23−27.
[26] JIANG S Q, HE H J, MA H J, et al. Quick assessment of chicken spoilage based on hyperspectral NIR spectra combined with partial least squares regression[J]. International Journal of Agricultural and Biological Engineering,2021,14(1):243−250. doi: 10.25165/j.ijabe.20211401.5726
-
期刊类型引用(2)
1. 龙会英,张德. 干热区紫花苜蓿的生产性能和营养价值评价. 草业科学. 2024(01): 117-125 .  百度学术
百度学术
2. 王子凌,张子豪,曾璐瑶,劳梦甜,王海滨,王琦,彭利娟,路洪艳,邹圣碧. 不同卤制加工阶段中食盐添加量对小龙虾尾品质及挥发性风味的影响. 食品科学. 2024(11): 52-60 . 百度学术
其他类型引用(2)
 下载:
下载:


计量
- 文章访问数: 128
- HTML全文浏览量: 34
- PDF下载量: 14
- 被引次数: 4