


Degradation Efficiency of Aflatoxin B1 by Cold Plasma
-
摘要: 目的:确定低温等离子体降解黄曲霉毒素B1(Aflatoxin B1,AFB1)最佳工艺条件,并探究其在农产品中应用的可行性。方法:选取低温等离子体不同激发条件(峰值电压、工作频率、作用时间),研究其对溶液中AFB1的降解效果。通过Center Composite Design(CCD)法进行响应面试验,获取最优降解组合及各因素交互作用机制,并考察此条件下玉米中AFB1降解效果。结果:当AFB1浓度为1000 μg/L时,其降解率随峰值电压及作用时间(除90~120 s)的增加,工作频率的下降而极显著升高(P<0.01)。响应面优化后最佳工艺条件为峰值电压160 kV、工作频率50 Hz、作用时间165 s,此时AFB1降解率为99.62%。此外,将优化后的降解条件在受AFB1污染的玉米(23.18±0.06 μg/kg)中进行应用,发现180 s处理时间下,其降解率可达39.29%。结论:通过CCD法确定了低温等离子体技术降解AFB1最优工艺,证实了其在玉米中的降解效果。表明低温等离子体技术在降低谷物黄曲霉毒素污染方面具有巨大潜力。Abstract: Objective: To determine the optimal process conditions for the degradation of aflatoxin B1 (AFB1) by cold plasma and explore the feasibility of its application in agricultural products, this study was performed. Methods: Different excitation conditions (peak voltage, working frequency and treatment time) of cold plasma were selected to investigate the degradation effect of AFB1 in solution. The optimal degradation combination and the interaction mechanism of various factors were obtained by center composite design (CCD) response surface test, under these conditions, the degradation effect of AFB1 in corn was investigated. Results: When the concentration of AFB1 was 1000 μg/L, the degradation rate increased significantly (P<0.01) with the increasing of peak voltage, treatment time (except for 90 to 120 s), and the decrease of working frequency. After response surface optimization, the degradation rate of AFB1 was 99.62% under the optimum degradation conditions of peak voltage 160 kV, working frequency 50 Hz, and treatment time 165 s. In addition, the optimized conditions were used for corn (23.18±0.06 μg/kg) contaminated by AFB1, the degradation rate reached 39.29% at 180 s. Conclusion: The optimal degradation process of AFB1 by cold plasma technology was determined by the CCD method, and its degradation effect in corn was confirmed. The results indicated that cold plasma technology had enormous potential to reduce aflatoxin contamination in cereals.
-
Keywords:
- cold plasma /
- aflatoxin B1 (AFB1) /
- peak voltage /
- working frequency /
- corn
-
黄曲霉毒素是由黄曲霉和寄生曲霉产毒菌株产生的聚酮类次级代谢产物[1],共有B1、B2、G1、G2、M1、M2等18种结构,以黄曲霉毒素B1(AflatoxinB1,AFB1)的毒性最强[2]。因低剂量即可导致肝脏致癌性,国际癌症研究机构将AFB1列为Ⅰ类致癌物[3]。联合国粮农组织(Food and Agriculture Organization of the United Nations,FAO)评估全世界约25% 农产品因受霉菌毒素污染而报废,其中黄曲霉毒素为主要污染物之一[4]。针对AFB1的严重危害性,如何安全有效地降低其污染水平成为了食品行业亟待解决的难题。AFB1结构稳定,在食品基质中一旦产生,便会持续存在[5],268 ℃高温下才可分解。目前,AFB1的降解技术根据作用原理可分为化学、生物和物理降解法,化学和生物降解法虽可有效地降低AFB1的含量,但是处理后AFB1降解产物安全性以及可能引发的食品安全问题为人们所担忧,仍需进一步的毒理学、安全学以及营养学分析评估[6-7];传统物理降解技术有辐照、紫外光催化以及臭氧熏蒸法,辐照处理下AFB1降解率一般较低,采用20 kGy的辐照剂量处理花生粕,降解率仅为14.4%[8],相同辐照剂量下处理AFB1含量为7.5 μg/kg的苦荞饭,降解率为33.6%[9],此外,辐照设备的成本较高,且长时间使用对于操作人员的健康存在威胁。紫外波长为362 nm的紫外光可以激发AFB1的活性从而促进其降解,但是由于穿透深度低、波长窄以及具有残留毒性,紫外线降解AFB1的应用受到限制[10];臭氧熏蒸法通常长时间处理才具有良好的降解效果,刘玉兰等[11]采用臭氧熏蒸玉米胚80 min,AFB1降解率为72.27%,花生油中采用此法降解AFB1,40 min降解率为82.43%[12]。
相对于传统物理降解技术造价高,耗时长,难以达到实际生产中快速降解AFB1含量的局限性,近年来,低温等离子体作为一项新兴技术,以其安全高效、非热加工、无残留[13]等优点受到了食品行业的广泛关注。根据其放电类型可将其分为介质阻挡放电(Dielectric barrier discharge,DBD)、辉光放电、电晕放电和射流放电四种。低温等离子体中含有大量高能活性粒子(H·、OH·、HO2·等)[14-15],已被证实可用于真菌如黄曲霉菌[16]的灭活以及多种毒素如黄曲霉毒素[17]、呕吐毒素[18]、以及T-2毒素[19]的降解。
目前报道的低温等离子体设备峰值电压较低且不可调频,高峰值电压可在短时间内产生更多的活性物质,可能会提高AFB1降解效能。此外,频率作为影响低温等离子设备活性物质产生速率的另一重要因素,不同研究中对于其与活性物质的生成速率的关系解释不同 ,将频率作为AFB1降解效能的影响因素并探究其与峰值电压交互关系的研究尚未见报道。本研究采用DBD低温等离子体设备,选取峰值电压、工作频率、作用时间作为单因素试验条件,以AFB1降解率作为衡量指标,采用响应面研究各因素的交互作用机制,并探究此技术在黄曲霉毒素阳性检出率较高的(3.5%~73%)[20]主要污染物玉米中的降解效果,从而为食品行业中的黄曲霉毒素污染提供新的解决方法。
1. 材料与方法
1.1 材料与仪器
玉米 市售;AFB1标准品(纯度≥99%) 新加坡普瑞邦生物工程有限公司;甲醇 色谱级,乙腈 色谱级,德国Merck公司;三氟乙酸 色谱级,上海麦克林生化科技有限公司;正已烷 色谱级,上海阿拉丁生化科技股份有限公司;高纯氮气(纯度≥99.999%) 南京特种气体厂。
介质阻挡放电低温等离子体设备 南京农业大学联合南京苏曼等离子体工程研究院研发;PriboFast®226多功能净化柱 新加坡普瑞邦生物工程有限公司;水浴氮吹仪 上海沪析实业有限公司;高速多功能粉碎机 武义海纳电器有限公司;LC-20 AD高效液相色谱仪(High performance liquid chromatography,HPLC) 日本岛津。
1.2 实验方法
1.2.1 样品预处理
样品包装:6孔板中加入1000 μg/L的AFB1溶液,置于包装盒(聚丙烯,145 mm×91 mm×22 mm)内密封包装。
样品处理:将包装后的样品放入DBD低温等离子体设备上下两极板之中,使其紧贴样品包装盒表面进行处理。
样品衍生:参照《GB 5009.22-2016 食品安全国家标准 食品中黄曲霉毒素B族和G族的测定》[21]中高效液相色谱-柱前衍生法进行衍生后待测。
1.2.2 HPLC条件
参照刘真等[22]的条件并稍作修改,具体为色谱柱:InertSustain® C18(4.6×250 mm,5 μm);流动相:乙腈:水(V:V=30:70);流速:0.8 mL/min;进样体积:20 μL;柱温:30 ℃;运行时间:12 min,荧光检测器:激发波长360 nm,发射波长440 nm。
1.2.3 标准曲线绘制
分别配制浓度为0、2.5、5、10、20、50、100、500、1000 μg/L的AFB1标准溶液,以浓度为横坐标,峰面积为纵坐标绘制标准曲线,得到标准曲线方程为y=138995.50x−1071189.75,R2=0.9984,具有良好的线性拟合关系,可用于定量分析。
1.2.4 单因素实验
固定单因素条件:峰值电压160 kV、工作频率50 Hz、作用时间180 s,分别考察不同峰值电压(60、80、100、120、140、160 kV)、工作频率(50、80、110、140、170、200 Hz)、作用时间(30、60、90、120、150、180 s)对AFB1降解率的影响,并结合降解率确定最佳因素水平。
1.2.5 响应面试验设计优化
采用Center Composite Design(CCD)试验设计模型进行条件优化,响应曲面因素水平表如表1所示。
表 1 响应面试验因素水平设计Table 1. Factor level design of response surface test因素 水平 −1 0 1 A:峰值电压(kV) 120 140 160 B:工作频率(Hz) 50 80 110 C:作用时间(s) 120 150 180 1.2.6 玉米中AFB1降解效果研究
1.2.6.1 染毒玉米样品制备及处理
玉米染毒:HPLC测得实验所用原料玉米中AFB1为1.05 μg/kg,为获得AFB1污染阳性样本[23],向50g玉米中加入0.5 mL AFB1甲醇溶液(1000 μg/L),混合均匀,于通风橱内挥发近干。
染毒玉米样品低温等离子体处理:将50 g玉米置于包装盒内,采用1.2.1同种处理方式进行低温等离子体处理。
玉米中AFB1提取:玉米样品经高速粉碎机粉碎后过0.85 mm孔径筛,称取5.00 g加入20 mL乙腈:水(V:V=86:14)高速搅拌2 min后,定性滤纸过滤,取8 mL滤液经PriboFast®226净化柱纯化,50 ℃水浴氮吹纯化液近干,衍生条件同1.2.1,加入500 μL流动相复溶后待测。
1.2.6.2 低温等离子体处理条件
选取1.2.5中优化后得出的最佳峰值电压和工作频率,考察不同作用时间(30、60、90、120、150、180 s)对玉米中AFB1降解率的影响。
1.3 数据处理
高效液相色谱平行三次测定AFB1含量。采用Origin 2022进行图形绘制,IBM SPSS Statistics 2.0进行数理统计分析;P<0.01表示差异极显著。结合Design-Expert v 8.0.6中CCD模型进行响应面实验设计与分析。
2. 结果与分析
2.1 单因素实验结果
2.1.1 峰值电压对AFB1降解率的影响
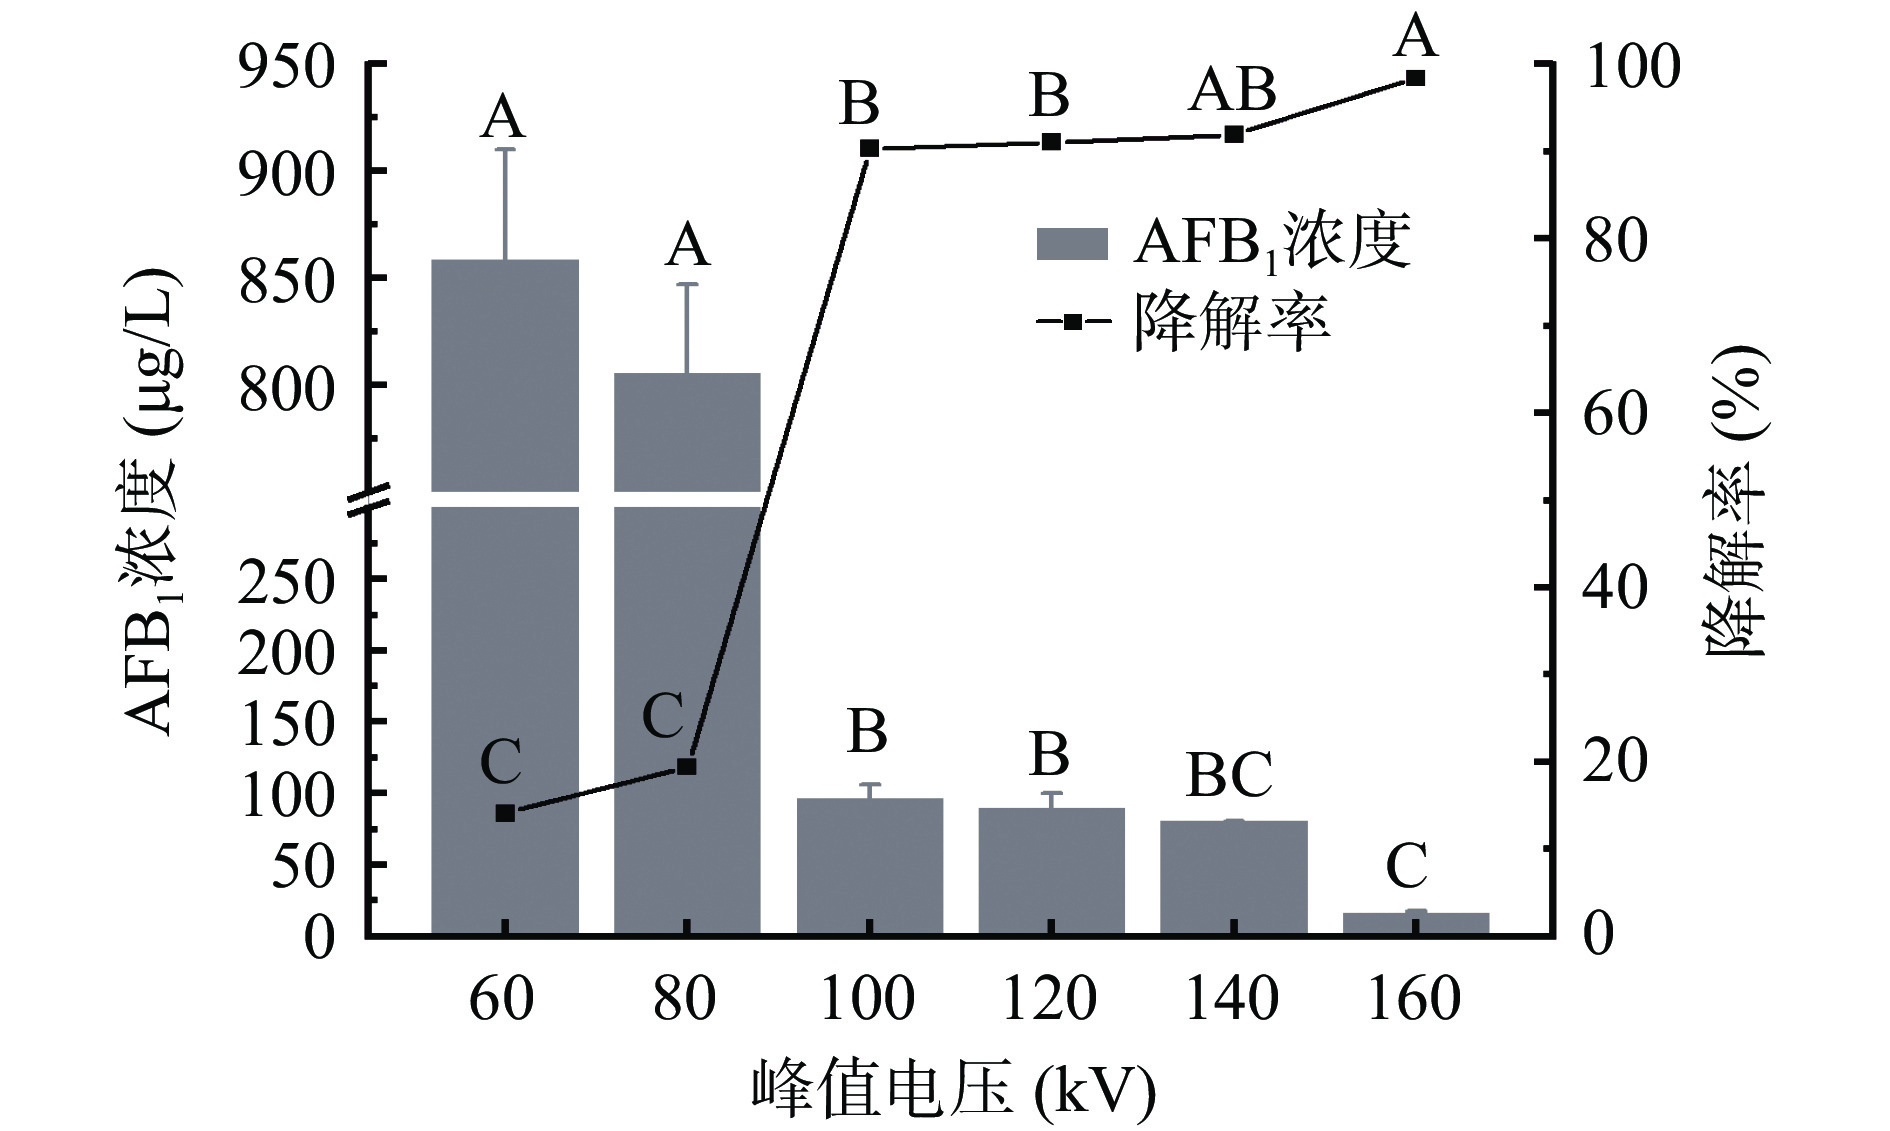
根据图1可知,AFB1降解率随着峰值电压的增加极显著升高(P<0.01),与Siciliano等[24]的研究结果一致。峰值电压为60 kV时,AFB1降解率为14.11%,HPLC法测得其含量为858.88±51.39 μg/L,当峰值电压由80 kV增加至100 kV时,AFB1含量极显著下降至96.65±9.77 μg/L(P<0.01),此时,降解率为90.34%。降解率随峰值电压的升高而增加的原因可能是峰值电压的提高导致介质阻挡放电两电极极板间的电场强度增大,自由电子崩解速度和强度增加,电子轰击和气体解离及电离的能力增强,从而提高了活性基团(如OH·、H·)的形成速度,加速了AFB1的降解[14,25]。当峰值电压提高至160 kV时,AFB1浓度降至15.97±1.73 μg/L,降解率达到最大值98.40%。综上,峰值电压最佳选择范围为120~160 kV。
![]()
2.1.2 工作频率对AFB1降解率的影响
根据图2可知,当频率为50 Hz时,AFB1的降解率达到最大值94.52%,此时HPLC法测得其浓度为55.73±10.55 μg/L,与王玉[26]和王翠华[27]在研究频率对微囊球藻毒素的降解效果中得到的50 Hz处理效果最佳的结论一致。随着频率在140~200 Hz范围内的持续提高,AFB1的浓度分别为426.62±52.42、764.03±2.84、794.61±23.95 μg/L,均极显著高于50 Hz处理组(P<0.01),且降解率极显著下降(P<0.01),表明工作频率的提高降低了AFB1的降解率,这可能与频率的改变导致的活性物质生成速率有关,Yuji等[28]与汪超[29]发现频率的提升可以促进脉冲放电等离子体射流中活性物质的产生,然而Wang等[30]发现频率的降低可以增加低温等离子体射流的放电强度从而促进活性物质的生成,可知等离子体激发方式不同对于活性物质生成速率影响不同,因此推测本研究中频率的上升会导致DBD型低温等离子体活性物质生成速率的下降,从而导致AFB1的降解率下降。综上,工作频率的选取范围为50~110 Hz。
![]() 图 2 不同工作频率对AFB1降解率的影响Figure 2. Effects of different working frequencies on the degradation rate of AFB1
图 2 不同工作频率对AFB1降解率的影响Figure 2. Effects of different working frequencies on the degradation rate of AFB12.1.3 作用时间对AFB1降解率的影响
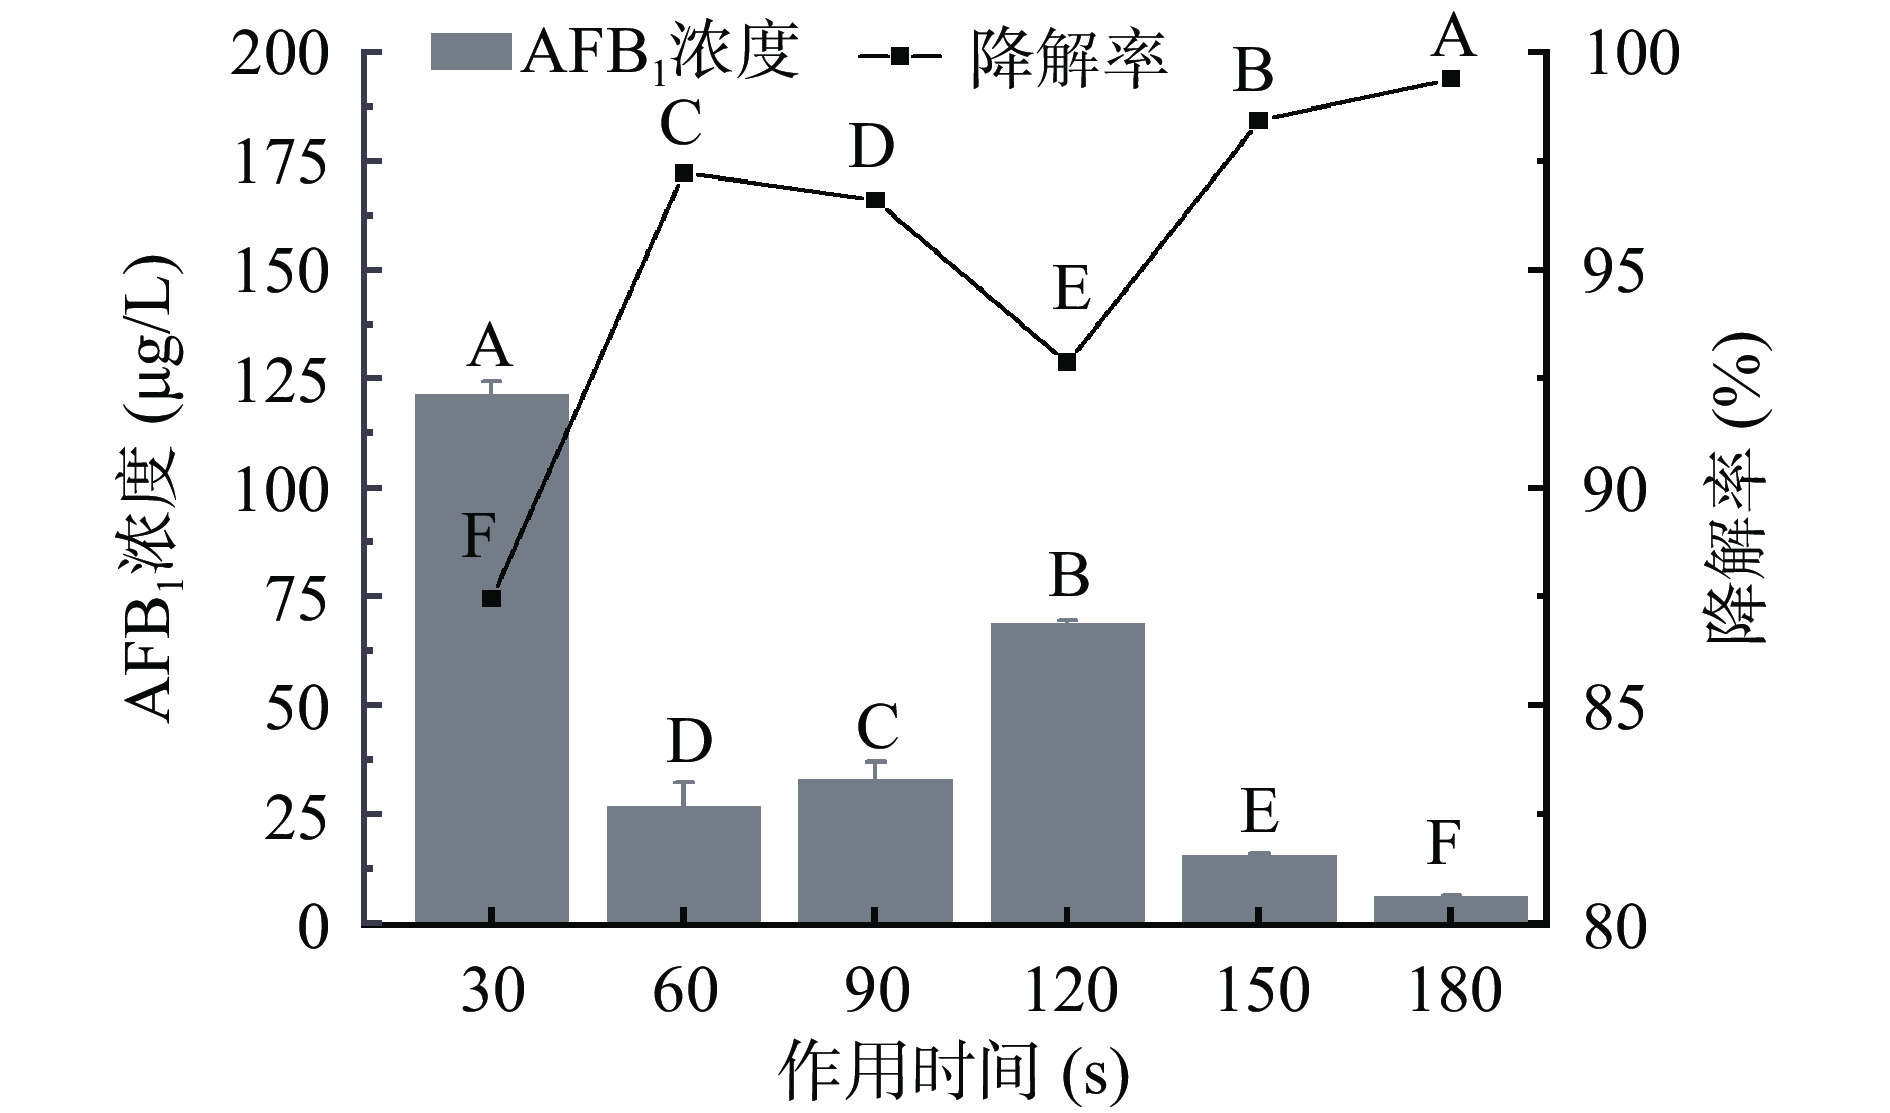
根据图3可知,低温等离子体处理极显著降低各处理组AFB1浓度(P<0.01)。30 s作用时间下,AFB1降解率为87.45%,相较于紫外处理200 μg/L的AFB1溶液,33 min 50%左右的降解效果[31],低温等离子体可在短时间内快速降低AFB1含量[32-33]。60 s作用时间下,AFB1浓度下降为26.74±5.57 μg/L,120 s内浓度回升至68.80±0.73 μg/L,降解率相比60 s下降了4.35%。可见,AFB1残留量并非随着作用时间的延长而持续上升,Nishimwe等[34]与杜黎等[35]采用低温等离子体降解AFB1时也出现浓度有所回升的现象。150~180 s作用时间内浓度下降至最低值6.14±0.17 μg/L,此时降解率为99.39%。综上,作用时间选取范围为120~180 s。
![]() 图 3 不同作用时间对AFB1降解率的影响Figure 3. Effects of different treatment times on the degradation rate of AFB1
图 3 不同作用时间对AFB1降解率的影响Figure 3. Effects of different treatment times on the degradation rate of AFB12.2 响应面试验结果
2.2.1 试验设计方案及结果
响应面作为一种研究相关参数和独立参数之间关系的有效统计方法,不仅可以减少试验次数并且可根据单因素条件选定水平[36-37],前期由单因素条件选定峰值电压、工作频率、作用时间的最佳取值范围,根据CCD模型设计方案进行试验,得到的试验结果如表2所示。
表 2 CCD设计方案及结果Table 2. Design scheme and result of CCD实验号 A B C 降解率(%) 峰值电压(kV) 工作频率(Hz) 作用时间(s) 1 120 50 120 76.45±1.01 2 160 50 120 90.02±0.89 3 120 110 120 46.89±0.28 4 160 110 120 83.49±1.03 5 120 50 180 87.84±0.76 6 160 50 180 99.80±0.05 7 120 110 180 53.16±0.23 8 160 110 180 86.22±0.11 9 120 80 150 68.04±0.78 10 160 80 150 90.13±1.03 11 140 50 150 92.01±0.99 12 140 110 150 80.14±0.24 13 140 80 120 75.12±0.34 14 140 80 180 82.15±1.10 15 140 80 150 85.07±0.63 16 140 80 150 87.03±0.71 17 140 80 150 88.88±0.18 18 140 80 150 87.24±1.12 19 140 80 150 85.10±0.86 20 140 80 150 89.88±0.59 2.2.2 模型方差分析
根据表3可知,模型中选取的A、B、C三因素与响应值Y之间均存在着显著性关系,且模型本身显著,失拟项不显著(P=0.2542>0.05),说明该模型构建合理[38],同时R2=0.9781,R2adj=0.9500,说明模型拟合程度和相关性良好,变异系数(CV=3.79%)说明各变量间相对离散程度极小,同时,A、B、C影响均极显著(P<0.01),A与B交互作用极显著(P<0.01),A2与C2分别显著(P<0.05)。综上,本模型能够较好的应用于低温等离子体对于AFB1降解效果的理论预测。根据F值可知,三因素对于AFB1降解率的影响次序分别为A(峰值电压)>B(工作频率)>C(作用时间)。
表 3 低温等离子体降解AFB1模型方差分析结果Table 3. Results of variance analysis of AFB1 degradation model by cold plasma方差来源 平方和 自由度 均方 F值 P值 模型 2931.69 9 325.74 34.77 < 0.0001** A 1375.46 1 1375.46 146.83 < 0.0001** B 925.83 1 925.83 98.83 < 0.0001** C 138.38 1 138.38 14.77 0.0063** AB 243.43 1 243.43 25.99 0.0014** AC 3.32 1 3.32 0.35 0.5706 BC 18.51 1 18.51 1.98 0.2026 A2 58.79 1 58.79 6.28 0.0407* B2 14.24 1 14.24 1.52 0.2573 C2 70.63 1 70.63 7.54 0.0287* 残差 65.57 7 9.37 失拟项 58.31 5 11.66 3.21 0.2542 随机误差 7.26 2 3.63 总残差 2997.27 16 注:*P<0.05表示显著,**P<0.01表示极显著。 2.2.3 回归方程的构建与交互作用分析
经Design-Expert v 8.0.6 拟合出的多项式回归方程为Y=−271.21699+3.29080A−1.76423B+2.12084C+9.19375×10⁻³AB−1.07292×10⁻³AC−1.69028×10⁻³BC−0.011711A2+2.56197×10⁻³B2−5.70469×10⁻³C2,因峰值电压与工作频率之间两者交互作用极显著(P<0.01),为量化两者交互作用关系变化对AFB1降解率的影响,对多项式回归方程计算得到的结果如表4、表5所示。
表 4 不同峰值电压下工作频率对AFB1降解率的影响Table 4. Effects of working frequency on the degradation rate of AFB1 at different peak voltages峰值电压(kV) 回归方程 工作频率(Hz) 降解率(%) 120 Y =125.50−0.91B+0.00256B2 178.48 43.89 130 Y =127.52−0.82B+0.00256B2 160.64 61.49 140 Y =127.20−0.73B+0.00256B2 142.59 75.11 150 Y =124.52−0.64B+0.00256B2 124.65 84.72 160 Y =119.53−0.55B+0.00256B2 107.71 90.36 表 5 不同工作频率下峰值电压对AFB1降解率的影响Table 5. Effects of peak voltage on the degradation rate of AFB1 at different working frequencies工作频率(Hz) 回归方程 峰值电压(kV) 降解率(%) 50 Y =−175.93+3.59A−0.0117A2 153.26 99.13 65 Y =−201.78+3.73A−0.0117A2 159.14 94.82 80 Y =−226.47+3.87A−0.0117A2 165.03 92.48 95 Y =−250.01+4.00A−0.0117A2 170.92 92.10 110 Y =−272.40+4.14A−0.0117A2 176.81 93.69 由图4可知,峰值电压与工作频率之间的响应面交互作用图倾斜程度明显,结合方差分析结果可知两者之间的交互作用对响应值影响极显著(P<0.01),当固定峰值电压不变时,AFB1的降解率随工作频率的升高,曲面整体向下倾斜,表明工作频率的升高会导致AFB1降解率的下降;固定工作频率不变时,随着峰值电压的升高,曲面图逐渐陡峭,表明峰值电压的增高可以促进AFB1的降解。根据表4回归方程分析结果可知,当作用时间趋近于0水平时,工作频率对于AFB1降解率的影响值随着峰值电压的升高,其临界值逐渐下降,两者之间呈反比例关系(y=−1.78x+391.36,R2=1),峰值电压在120~160 kV的范围内升高,AFB1的降解率增加幅度明显,与其单因素结果一致。由表5对工作频率与峰值电压的回归方程分析结果可知,峰值电压的临界值随工作频率的增加而增加,两者之间呈正比例关系(y=0.39x+133.63,R2=1),且工作频率的增加会总体导致AFB1降解率的下降,但下降幅度较为平缓,与工作频率中50~110 Hz范围内,其降解率无显著性的差异结果一致。
![]() 图 4 峰值电压与工作频率交互作用图Figure 4. Interaction diagram of peak voltage and working frequency
图 4 峰值电压与工作频率交互作用图Figure 4. Interaction diagram of peak voltage and working frequency2.2.4 CCD模型优化条件验证
由CCD模型得到的峰值电压、工作频率、作用时间的最佳优化参数分别为157.16 kV、50.05 Hz、165.18 s,此时AFB1降解率的预测值为100%,为简便实际操作,选定峰值电压160 kV、工作频率50 Hz、作用时间165 s,三次重复验证实验得出AFB1浓度为3.8±1.2 μg/L,降解率为99.62%±0.12%,与预测值结果相差0.38%,表明该模型拟合效果良好,具有实际参考意义。
2.3 低温等离子体作用时间对玉米中AFB1降解效果的影响
根据2.2.4中CCD模型优化结果选取峰值电压160 kV,工作频率50 Hz作为固定条件,探究不同作用时间下低温等离子体对于玉米中AFB1的降解效果,结果如图5所示。
![]() 图 5 不同作用时间对玉米中AFB1降解效果的影响Figure 5. Effects of different treatment time on AFB1 degradation in corn
图 5 不同作用时间对玉米中AFB1降解效果的影响Figure 5. Effects of different treatment time on AFB1 degradation in corn根据图5可知,低温等离子体处理浓度为23.35±0.79 μg/kg的玉米阳性样品30 s时,AFB1降解率为7.25%。随着处理时间的延长,玉米中AFB1降解率在180 s极显著上升至39.29%(P<0.01),优于常压等离子体处理1.25 μg/kg玉米样品10 min时65%的降解效果[39]。此时HPLC 法测得玉米中AFB1剩余含量为14.17±0.05 μg/kg,低于《GB 2761-2017 食品安全国家标准 食品中真菌毒素限量》[40]对玉米中AFB1限量(20 μg/kg)。此外,目前报道的利用飞行时间质谱对低温等离子体降解AFB1产物结构解析时,发现AFB1的主要致毒基团双呋喃环结构消失,降解产物相较AFB1毒性降低[17,39,41]。同时,与溶液中AFB1的降解效果进行对比,发现其降解效率低于溶液中相同时间下90%以上的降解效果。玉米与溶液中降解效果不同可能是由于溶液中的AFB1在处理时可以充分暴露于低温等离子体中,但玉米表面不平整,加标于玉米中的AFB1无法与低温等离子体充分接触所造成的[35]。
3. 结论
本文研究了低温等离子体激发条件(峰值电压、工作频率、作用时间)对溶液中AFB1的降解效果,并通过CCD模型优化工艺参数,在最优峰值电压与工作频率下,探究其在主要污染物玉米中的降解效果,结论如下:与对照组相比,溶液中AFB1降解率随峰值电压的升高、工作频率的下降、作用时间的延长分别极显著上升(P<0.01)。响应面优化结果表明在峰值电压为160 kV、工作频率50 Hz、作用时间165 s的条件下,AFB1降解率达到最优值99.62%,此时HPLC测得浓度为3.8±1.2 μg/L。低温等离子体处理玉米阳性样品180 s时AFB1降解率为39.29%,表明低温等离子体技术在玉米中对AFB1仍具有降解效果。综上,低温等离子体技术可在短时间内降低AFB1污染水平,工业化应用前景广阔,但仍需深入大通量处理食品的低温等离子体设备研发以满足实际生产要求。
-
![]()
![]()
图 2 不同工作频率对AFB1降解率的影响
Figure 2. Effects of different working frequencies on the degradation rate of AFB1
![]()
图 3 不同作用时间对AFB1降解率的影响
Figure 3. Effects of different treatment times on the degradation rate of AFB1
![]()
图 4 峰值电压与工作频率交互作用图
Figure 4. Interaction diagram of peak voltage and working frequency
![]()
图 5 不同作用时间对玉米中AFB1降解效果的影响
Figure 5. Effects of different treatment time on AFB1 degradation in corn
表 1 响应面试验因素水平设计
Table 1 Factor level design of response surface test
因素 水平 −1 0 1 A:峰值电压(kV) 120 140 160 B:工作频率(Hz) 50 80 110 C:作用时间(s) 120 150 180  下载: 导出CSV
表 2 CCD设计方案及结果
Table 2 Design scheme and result of CCD
实验号 A B C 降解率(%) 峰值电压(kV) 工作频率(Hz) 作用时间(s) 1 120 50 120 76.45±1.01 2 160 50 120 90.02±0.89 3 120 110 120 46.89±0.28 4 160 110 120 83.49±1.03 5 120 50 180 87.84±0.76 6 160 50 180 99.80±0.05 7 120 110 180 53.16±0.23 8 160 110 180 86.22±0.11 9 120 80 150 68.04±0.78 10 160 80 150 90.13±1.03 11 140 50 150 92.01±0.99 12 140 110 150 80.14±0.24 13 140 80 120 75.12±0.34 14 140 80 180 82.15±1.10 15 140 80 150 85.07±0.63 16 140 80 150 87.03±0.71 17 140 80 150 88.88±0.18 18 140 80 150 87.24±1.12 19 140 80 150 85.10±0.86 20 140 80 150 89.88±0.59
下载: 导出CSV
表 3 低温等离子体降解AFB1模型方差分析结果
Table 3 Results of variance analysis of AFB1 degradation model by cold plasma
方差来源 平方和 自由度 均方 F值 P值 模型 2931.69 9 325.74 34.77 < 0.0001** A 1375.46 1 1375.46 146.83 < 0.0001** B 925.83 1 925.83 98.83 < 0.0001** C 138.38 1 138.38 14.77 0.0063** AB 243.43 1 243.43 25.99 0.0014** AC 3.32 1 3.32 0.35 0.5706 BC 18.51 1 18.51 1.98 0.2026 A2 58.79 1 58.79 6.28 0.0407* B2 14.24 1 14.24 1.52 0.2573 C2 70.63 1 70.63 7.54 0.0287* 残差 65.57 7 9.37 失拟项 58.31 5 11.66 3.21 0.2542 随机误差 7.26 2 3.63 总残差 2997.27 16 注:*P<0.05表示显著,**P<0.01表示极显著。
下载: 导出CSV
表 4 不同峰值电压下工作频率对AFB1降解率的影响
Table 4 Effects of working frequency on the degradation rate of AFB1 at different peak voltages
峰值电压(kV) 回归方程 工作频率(Hz) 降解率(%) 120 Y =125.50−0.91B+0.00256B2 178.48 43.89 130 Y =127.52−0.82B+0.00256B2 160.64 61.49 140 Y =127.20−0.73B+0.00256B2 142.59 75.11 150 Y =124.52−0.64B+0.00256B2 124.65 84.72 160 Y =119.53−0.55B+0.00256B2 107.71 90.36
下载: 导出CSV
表 5 不同工作频率下峰值电压对AFB1降解率的影响
Table 5 Effects of peak voltage on the degradation rate of AFB1 at different working frequencies
工作频率(Hz) 回归方程 峰值电压(kV) 降解率(%) 50 Y =−175.93+3.59A−0.0117A2 153.26 99.13 65 Y =−201.78+3.73A−0.0117A2 159.14 94.82 80 Y =−226.47+3.87A−0.0117A2 165.03 92.48 95 Y =−250.01+4.00A−0.0117A2 170.92 92.10 110 Y =−272.40+4.14A−0.0117A2 176.81 93.69
下载: 导出CSV
-
[1] DIAO E J, SHAN C P, HOU H X, et al. Structures of the ozonolysis products and ozonolysis pathway of aflatoxin B1 in acetonitrile solution[J]. Journal of Agricultural and Food Chemistry,2012,60(36):9364−9370. doi: 10.1021/jf302528e
[2] BHAT R, RAIR V, KARIM A A. Mycotoxins in food and feed: present status and future concerns[J]. Comprehensive Reviews in Food Science and Food Safety,2010,9(1):57−81. doi: 10.1111/j.1541-4337.2009.00094.x
[3] OSTRY V, MALIR F, TOMAN J, et al. Mycotoxins as human carcinogens-the IARC monographs classification[J]. Mycotoxin Research,2017,33(1):65−73. doi: 10.1007/s12550-016-0265-7
[4] THANUSHREE M P, SAILENDRI D, YOHA K S, et al. Mycotoxin contamination in food: An exposition on spices[J]. Trends in Food Science & Technology,2019,93:69−80.
[5] SANI A M, AZIZI E G, SALEHI E A, et al. Reduction of aflatoxin in rice by different cooking methods[J]. Toxicology and Industrial Health,2014,30(6):546−550. doi: 10.1177/0748233712462466
[6] ISMAIL A, GONCALVES B L, DE NEEFF D V, et al. Aflatoxin in foodstuffs: occurrence and recent advances in decontamination[J]. Food Research International,2018,113:74−85. doi: 10.1016/j.foodres.2018.06.067
[7] 胡振阳, 都立辉, 袁康, 等. 稻谷黄曲霉毒素的检测与污染控制研究进展[J]. 中国粮油学报,2020,35(1):175−185. [HU Z Y, DU L H, YUAN K, et al. Detection of aflatoxin of rice progress in research on pollution control[J]. Journal of the Chinese Cereals and Oils Association,2020,35(1):175−185. doi: 10.3969/j.issn.1003-0174.2020.01.029 [8] 王锋. 黄曲霉毒素B1的辐射降解机理及产物结构特性分析[D]. 北京: 中国农业科学院, 2012. WANG F. Analysis on irradiation-induced degradation mechanism and radiolytic products of aflatoxin B1[D]. Beijing: Chinese Academy of Agricultural Sciences, 2012.
[9] 刘辉, 卢扬, 唐建波, 等. 贵州苦荞饭中黄曲霉毒素B1物理降解技术对比[J]. 食品工业科技,2020,41(6):204−209. [LIU H, LU Y, TANG J B, et al. Comparison of physical degradation techniques of aflatoxin B1 in Guizhou tartary buckwheat rice[J]. Science and Technology of Food Industry,2020,41(6):204−209. [10] PANKAJ S K, SHI H, KEENER K M. A review of novel physical and chemical decontamination technologies for aflatoxin in food[J]. Trends in Food Science & Technology,2018,71:73−83.
[11] 刘玉兰, 郑婷婷, 马宇翔, 等. 臭氧熏蒸对玉米胚中真菌毒素的降解消除作用[J]. 食品科学,2022,43(3):77−82. [LIU Y L, ZHENG T T, MA X Y, et al. Effect of ozone fumigation on the removal of mycotoxins in corn germ[J]. Food Science,2022,43(3):77−82. [12] 李超. 臭氧处理粮油制品中真菌毒素及对品质影响的研究[D]. 镇江: 江苏科技大学, 2020. LI C. Study on ozone treatment of mycotoxins and quality of grain and oil products[D]. Zhenjiang: Jiangsu University of Science and Technology, 2020.
[13] WANG X Y, WANG S H, YAN Y Z, et al. The degradation of Alternaria mycotoxins by dielectric barrier discharge cold plasma[J]. Food Control,2020:117.
[14] YAN Y Z, FENG L L, SHI M M, et al. Effect of plasma-activated water on the structure and in vitro digestibility of waxy and normal maize starches during heat-moisture treatment[J]. Food Chemistry,2020:306.
[15] WU Y, CHENG J H, SUN D W. Blocking and degradation of aflatoxins by cold plasma treatments: Applications and mechanisms[J]. Trends in Food Science & Technology,2021,109:647−661.
[16] BAGHERI H, ABBASZADEH S, SALARI A. Optimization of decontamination conditions for Aspergillus flavus inoculated to military rations snack and physicochemical properties with atmospheric cold plasma[J]. Journal of Food Safety,2020,40(6):e12850.
[17] HOJNIK N, MODIC M, WALSH J L, et al. Unravelling the pathways of air plasma induced aflatoxin B1 degradation and detoxification[J]. Journal of Hazardous Materials,2021:403.
[18] 邢常瑞, 孔志康, 洪静, 等. 低温等离子体降解呕吐毒素效果评价及降解规律解析[J]. 中国粮油学报,2022,37(4):1−7. [XING C R, KONG Z K, HONG J, et al. Evaluation of the effect of low-temperature plasma on the degradation of vomitoxin and analysis of degradation law[J]. Journal of the Chinese Cereals and Oils Association,2022,37(4):1−7. [19] KIS M, MILOSEVIC S, VULIC A, et al. Efficacy of low pressure DBD plasma in the reduction of T-2 and HT-2 toxin in oat flour[J]. Food Chemistry,2020,316:126372. doi: 10.1016/j.foodchem.2020.126372
[20] 劳文艳, 林素珍. 黄曲霉毒素对食品的污染及危害[J]. 北京联合大学学报(自然科学版),2011,25(1):64−69. [LAO W Y, LIN S Z. The Contamination and hazards of aflatoxin on food[J]. Journal of Beijing Union University (Natural Sciences),2011,25(1):64−69. doi: 10.3969/j.issn.1005-0310.2011.01.014 [21] 中华人民共和国国家卫生和计划生育委员会, 国家食品药品监督管理总局. GB 5009.22-2016 食品安全国家标准 食品中黄曲霉毒素B族和G族的测定[S]. 北京: 中国标准出版社, 2016. State Health and Family Planning Commission of the People's Republic of China, State Food and Drug Administration. GB 5009.22-2016 National Food Safety Standard. Determination of aflatoxin group B and group G in food[S] Beijing: China Standards Press, 2016
[22] 刘真, 王世清, 肖军霞, 等. 花生中的物质成分对低温射频等离子体降解黄曲霉毒素B1的影响[J]. 食品科学,2016,37(21):219−223. [LIU Z, WANG S Q, XIAO J X, et al. Effect of peanut components on the degradation of aflatoxin B1 by low temperature radio frequency plasma[J]. Food Science,2016,37(21):219−223. [23] DARWISH D S, IKENAKA Y, NAKAYAMA S M M, et al. An overview on mycotoxin contamination of foods in Africa[J]. Journal of Veterinary Medical Science,2014,76(6).
[24] SICILIANO I, SPADARO D, PRELLE A, et al. Use of cold atmospheric plasma to detoxify hazelnuts from aflatoxins[J]. Toxins,2016,8(5).
[25] DEVI Y, THIRUMDAS R, SARANGAPANI C, et al. Influence of cold plasma on fungal growth and aflatoxins production on groundnuts[J]. Food Control,2017,77:187−191. doi: 10.1016/j.foodcont.2017.02.019
[26] 王玉. 介质阻挡放电对微囊藻毒素的去除研究[D]. 大连: 大连理工大学, 2007. WANG Y. Study on removal of microcystin by dielectric barrier discharges[D]. Dalian: Dalian University of Technology, 2007.
[27] 王翠华. 脉冲放电等离子体杀菌灭藻及其藻毒素去除的研究[D]. 大连: 大连理工大学, 2008. WANG C H. Study on the inactivation of bacterium and algae and removal of microcystins by plasma generated by pulsed discharge[D]. Dalian: Dalian University of Technology, 2008.
[28] YUJI T, NAKABAYASHI K, KINOSHITA H, et al. Development of decontamination treatment techniques for dry powder foods by atmospheric pressure nonequilibrium DC pulse discharge plasma jet[J]. Journal of Food Quality,2021,2021:8896716.
[29] 汪超. 脉冲电晕放电等离子体耦合土壤颗粒去除水中盐酸四环素的研究[D]. 杨凌: 西北农林科技大学, 2018. WANG C. Removal of tetracycline antibiotics from wastewater by pulsed corona discharge plasma coupled with soil particles[D]. Yangling: Northwest University of Agriculture and Forestry Science and Technology, 2018.
[30] WANG Y T, JIANG Y Z, XU G W, et al. Study on sterilization effect of different forms of atmospheric pressure plasma jet[C]// 12th International Conference on the Properties and Applications of Dielectric Materials (icpadm 2018), 2018: 867−871.
[31] 刘睿杰. 黄曲霉毒素B1在不同介质中紫外降解机理及安全性评价[D]. 无锡: 江南大学, 2011. LIU R J. Photodegradation mechanisms and safety evaluation of aflatoxin B1 in different medias[D]. Wuxi: Jiangnan University, 2011.
[32] GAVAHIAN M, CULLEN P J. Cold plasma as an emerging technique for mycotoxin-free food: Efficacy, mechanisms, and trends[J]. Food Reviews International,2020,36(2):193−214. doi: 10.1080/87559129.2019.1630638
[33] MISRA N N, YADAV B, ROOPESH M S, et al. Cold plasma for effective fungal and mycotoxin control in foods: Mechanisms, inactivation effects, and applications[J]. Comprehensive Reviews in Food Science and Food Safety,2019,18(1):106−120. doi: 10.1111/1541-4337.12398
[34] NISHIMWE K, AGBEMAFLE I, REDDY M B, et al. Cytotoxicity assessment of aflatoxin B1 after high voltage atmospheric cold plasma treatment[J]. Toxicon,2021:194.
[35] 杜黎, 陈定, 李俊, 等. 冷等离子体处理去除大豆油中黄曲霉毒素B1的研究[J]. 食品安全质量检测学报,2021,12(13):5314−5321. [DU L, CHENG D, LI J, et al. Study on the removal of aflatoxin B1 in soybean oil by cold plasma treatment[J]. Journal of Food Safety & Quality,2021,12(13):5314−5321. [36] SHI H, ILELEJI K, STROSHINE R L, et al. Reduction of aflatoxin in corn by high voltage atmospheric cold plasma[J]. Food and Bioprocess Technology,2017,10(6):1042−1052. doi: 10.1007/s11947-017-1873-8
[37] ZHUANG H, ROTHROCK M J, LINE J E, et al. Optimization of in-package cold plasma treatment conditions for raw chicken breast meat with response surface methodology[J]. Innovative Food Science & Emerging Technologies,2020:66.
[38] YOLMEH M, JAFARI S M. Applications of response surface methodology in the food industry processes[J]. Food and Bioprocess Technology,2017,10(3):413−433. doi: 10.1007/s11947-016-1855-2
[39] WIELOGORSKA E, AHMED Y, MENEELY J, et al. A holistic study to understand the detoxification of mycotoxins in maize and impact on its molecular integrity using cold atmospheric plasma treatment[J]. Food Chemistry,2019,301:125281. doi: 10.1016/j.foodchem.2019.125281
[40] 中华人民共和国国家卫生健康委员会, 国家市场监督管理总局. GB 2761-2017 食品安全国家标准 食品中真菌毒素限量[S]. 北京: 中国标准出版社, 2017. National Health Commission of the People's Republic of China, State Administration for Market Regulation. GB 2761-2017 National food safety standard. Limit of mycotoxins in food[S]. Beijing: China Standards Press, 2017.
[41] SHI H, COOPER B, STROSHINE R L, et al. Structures of degradation products and degradation pathways of aflatoxin B1 by high-voltage atmospheric cold Plasma (HVACP) treatment[J]. Journal of Agriculture and Food Chemistry,2017,65(30):6222−6230. doi: 10.1021/acs.jafc.7b01604
-
期刊类型引用(2)
1. 李夏,钱婧,章建浩,严文静. 等离子体活化水联合介质阻挡放电处理对鲜切莴苣杀菌效果及品质的影响. 食品工业科技. 2024(19): 196-205 .  本站查看
本站查看
2. 张文乐,张绍君,黄渭元,王英. 冷等离子体降解葡萄干中赭曲霉毒素A模型. 农业工程. 2024(12): 104-109 . 百度学术
其他类型引用(0)
 下载:
下载:


计量
- 文章访问数: 224
- HTML全文浏览量: 62
- PDF下载量: 27
- 被引次数: 2
